Political harassment is perceived as severe, unacceptable behavior by most citizens

Søren Damsbo-Svendsen
Karina Kosiara-Pedersen

November 19, 2025

Motivation

  • Common conception:
    • political violence is increasingly accepted
    • harassment against politicians no longer perceived as serious problem
  • Limited empirical evidence – with broad scope
    • e.g., many expressions, not only online, different contexts
  • RQ: How severe is harassment of politicians perceived to be by citizens,
    and who finds it less severe?
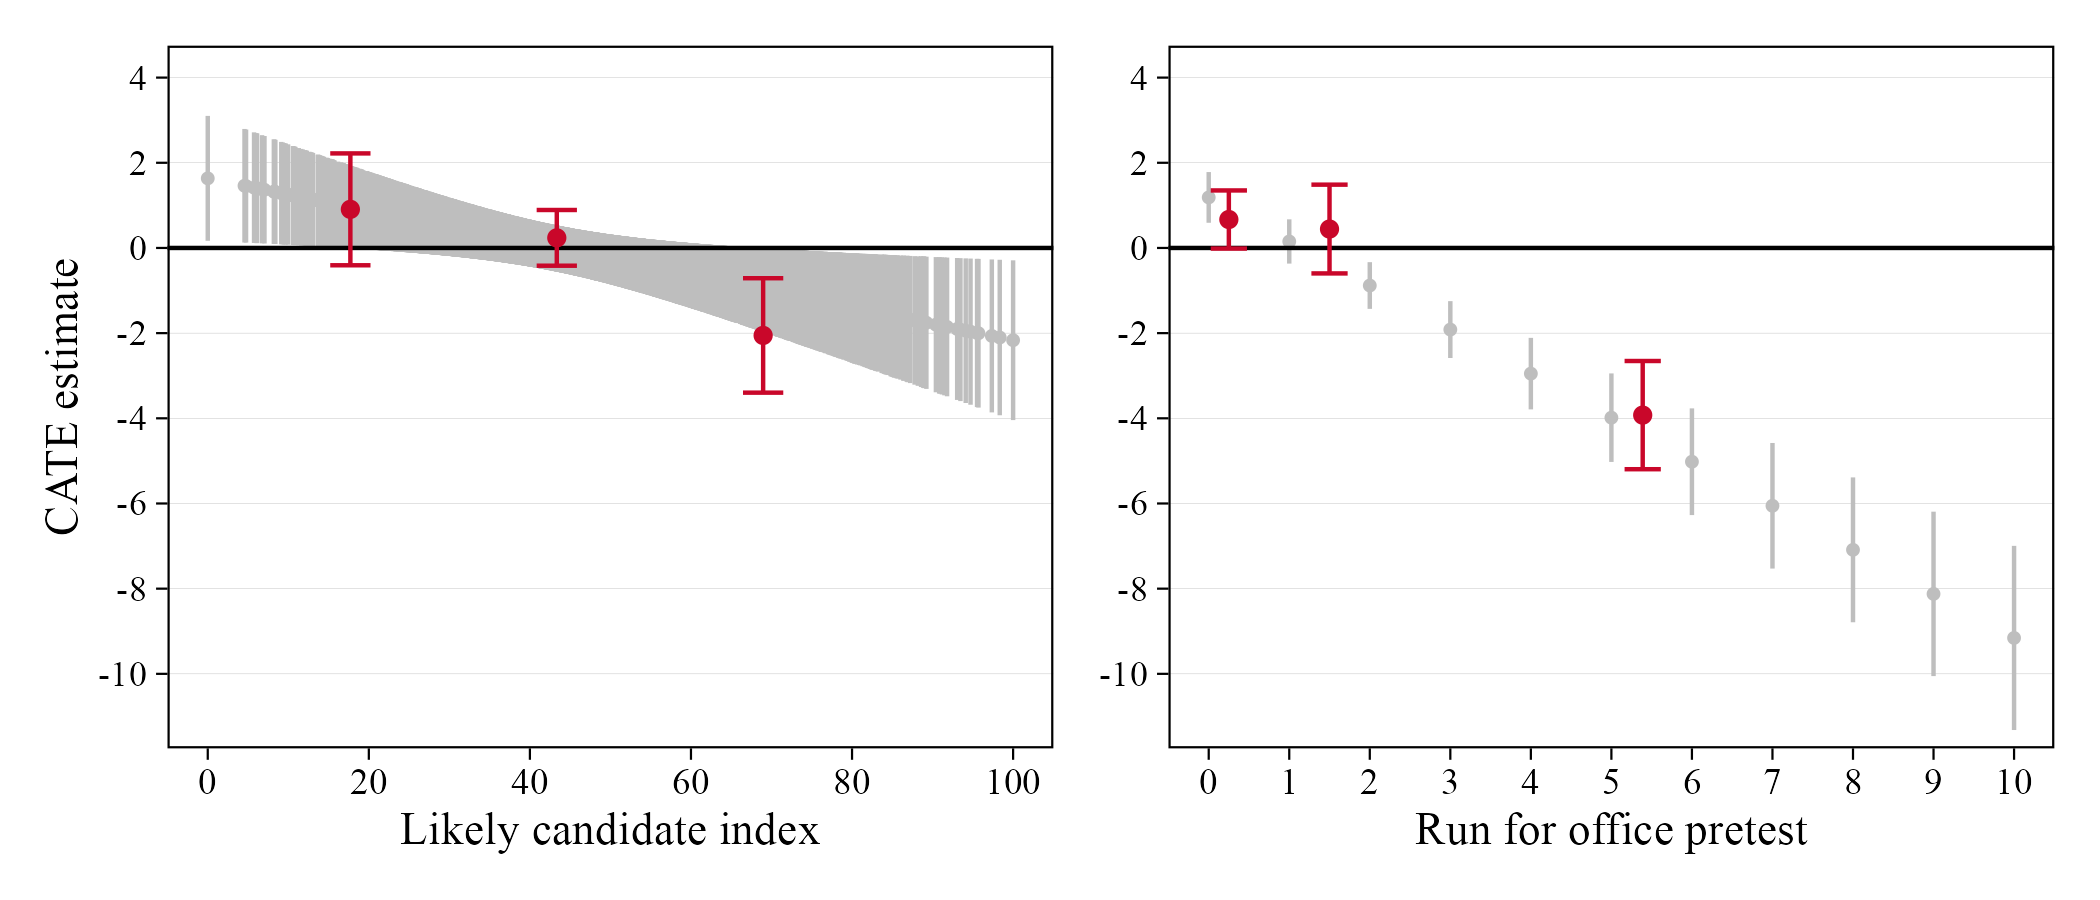
  • New survey data — shared with experimental study:

Experiment

‘Raising awareness of harassment against politicians: Experimental evidence of disengagement among likely future candidates’
Status

  • Second-ish draft
    • empirics quite far
    • theory quite undeveloped
  • Updated framing after DIPAS workshop in Sept:
    • push back against conception that acceptance of violence is growing/high
    • emphasize groups with higher acceptance

Design

  • Large citizen survey: n = 8,899
    • DK: n = 5,008 (YouGov)
    • DE = 1,519, UK = 1,515, FR = 857 (Prolific)
  • Stimuli: 55 true stories of (Danish) politicians’ experiences with harassment
    • source: 2021 municipal election candidate survey (n = 3,986)
    • hand-selected and edited (~ 24 words each)
  • Task: read + judge 5 random harassment stories
  • Outcome: perceived severity index
    • => 43,460 severity judgments of 55 diverse harassment stories

Harassment story examples

‘I have experienced coming home to several of the trees in my front yard having been cut down.’

‘I have experienced that my politician page on Facebook was shared by a fake profile with an encouragement to comment negatively on all my posts.’

‘I have received death threats from unknown senders directed at both my little brothers and my own children.’

‘There was a citizen who drove around in a car and measured how high my - and only my - posters were placed from the ground. He then reported me to the police for posters that were placed too low.’

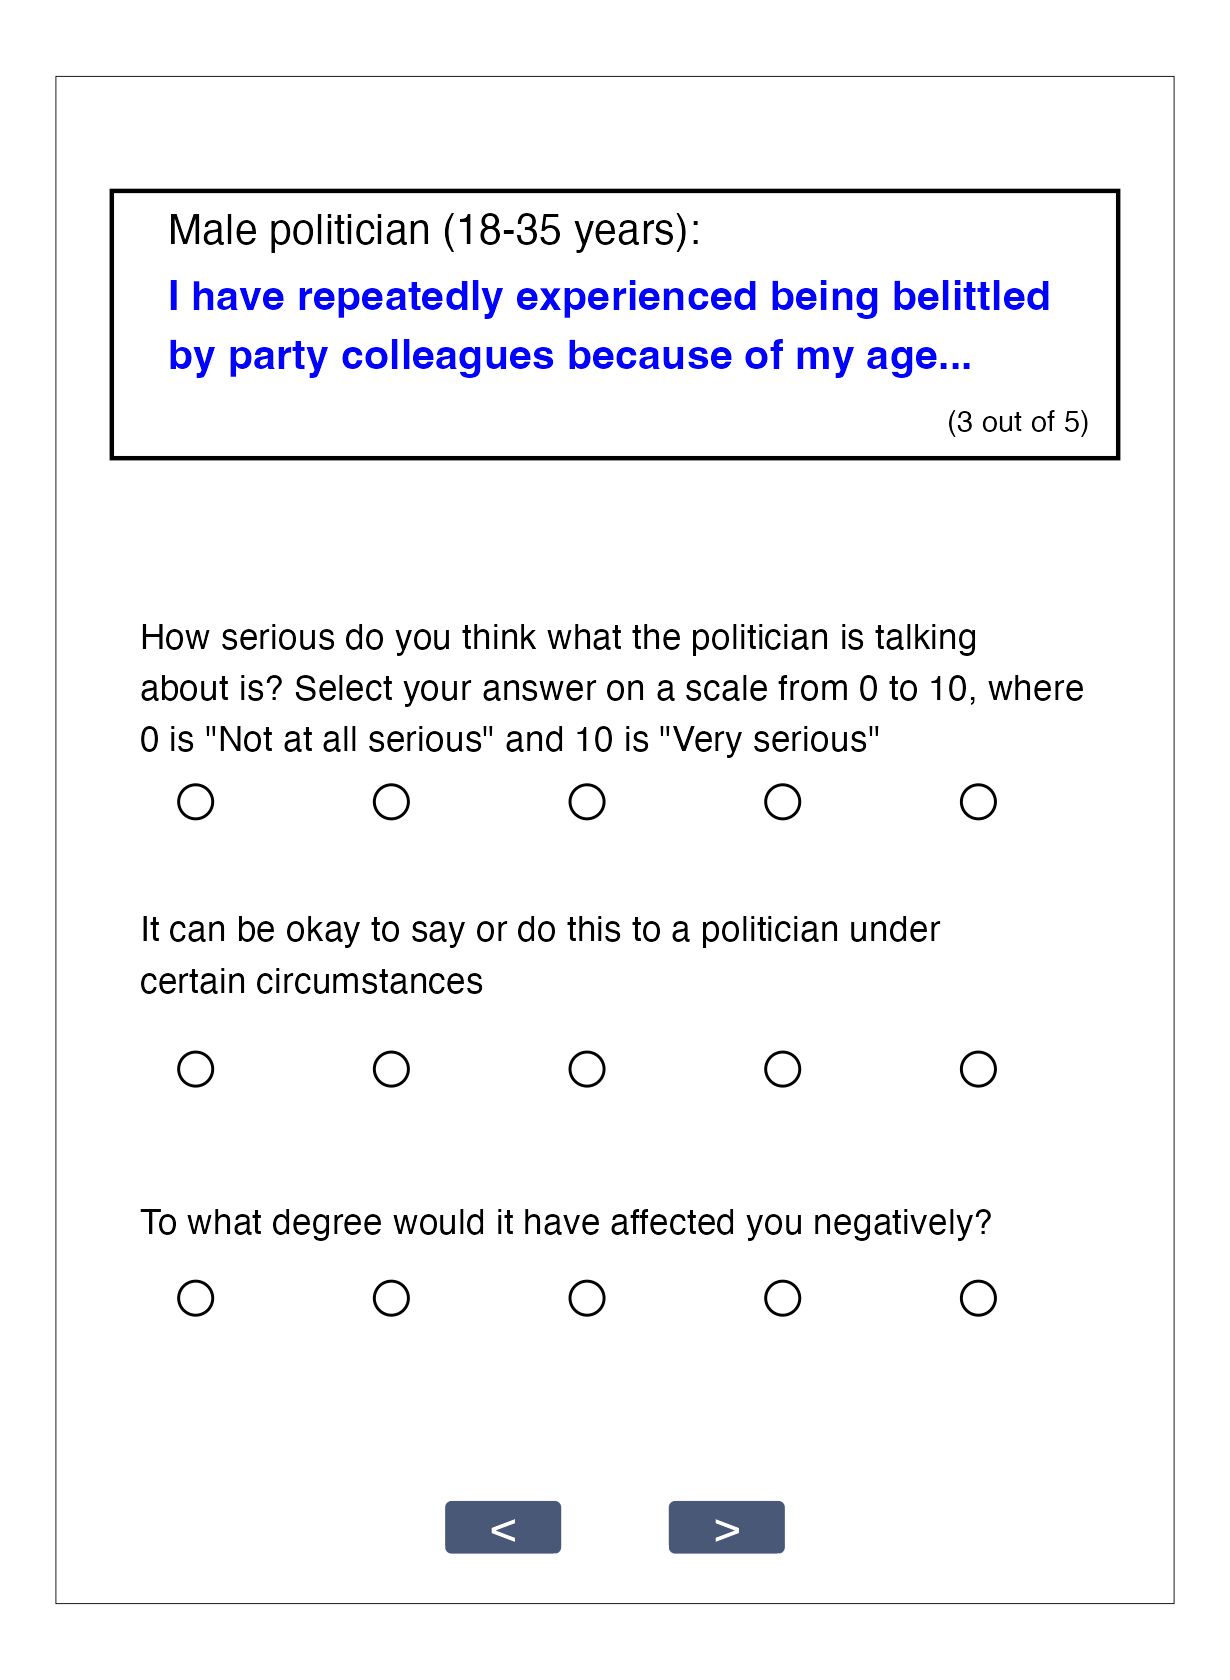
How the stories are presented


  • 1 of 4 politician gender-age categories (randomized)

  • Story

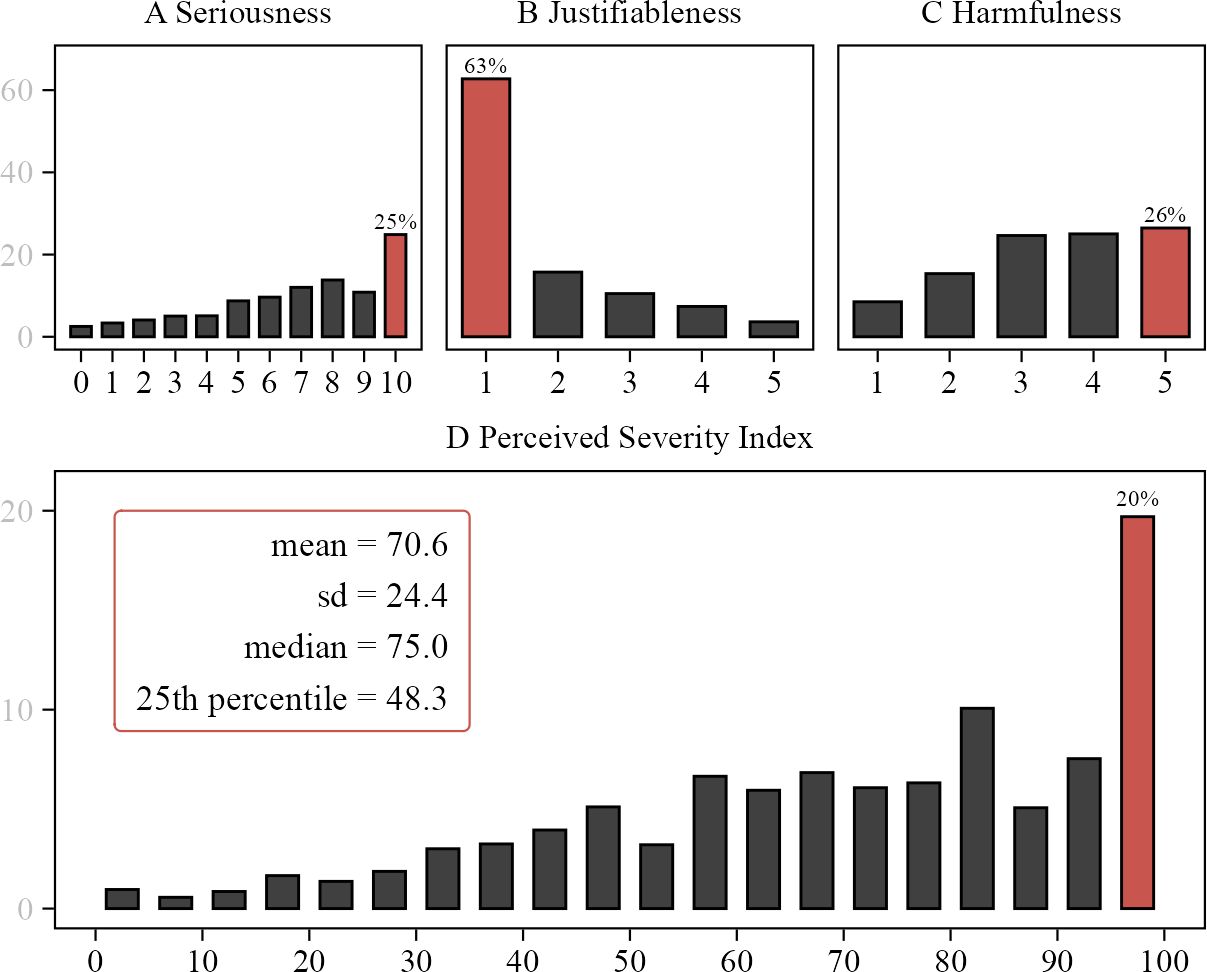
  • Judgment on three dimensions:

    • A Seriousness
    • B Justifiableness
    • C Harmfulness


Perceived severity

  • Outcome: judgments combined into a perceived severity index
    • => effectively, respondents rate each story’s severity from 0 to 100
  • Predictors – or ‘gaps’ of interest:
    1. respondent gender and age
    2. politician gender and age
    3. gender-age affinity (shared identity)
    4. political ideology
    5. harassment type
  • Main analysis: OLS regression of (mean) predicted severity by each predictor/group

Results


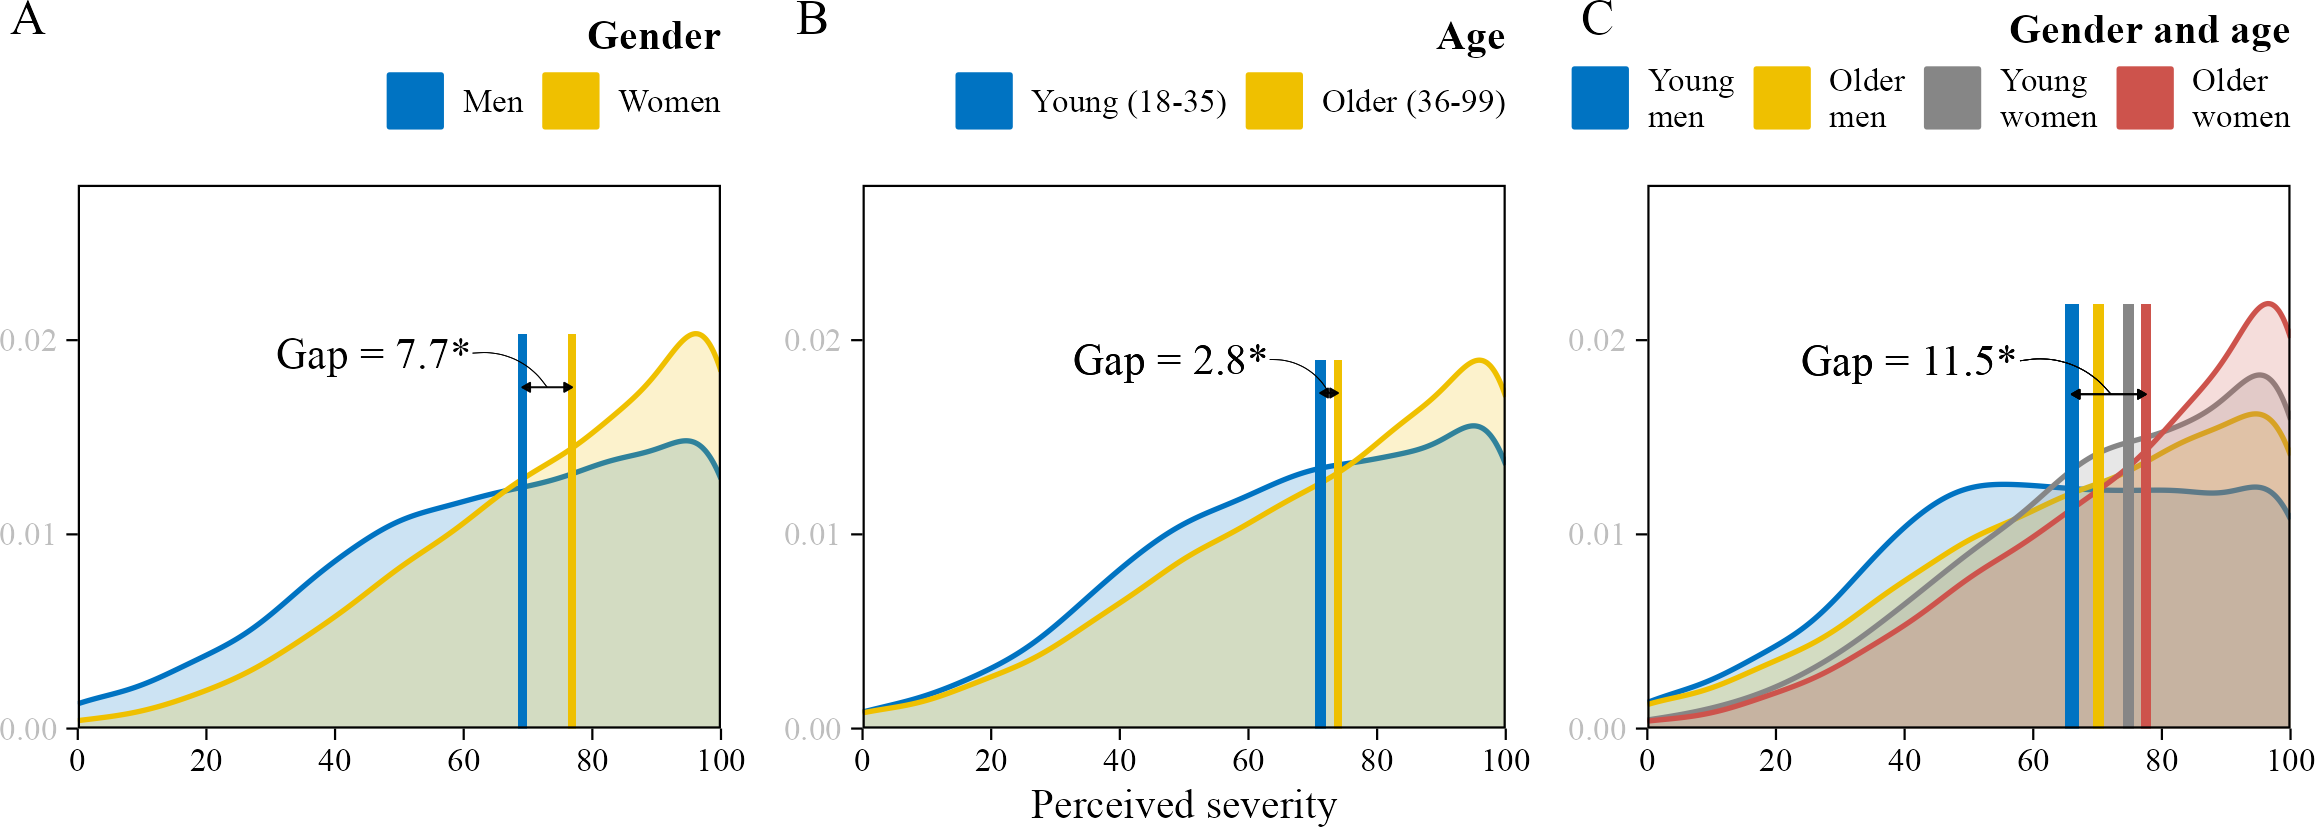
Gender and age


Political harassment is perceived as less severe …

  • H1: by men

  • H2: by older people

Gender and age


Gender and age


  • Lower for men (H1 +)
  • Lower for young people (H2 -)
  • Lowest among young men

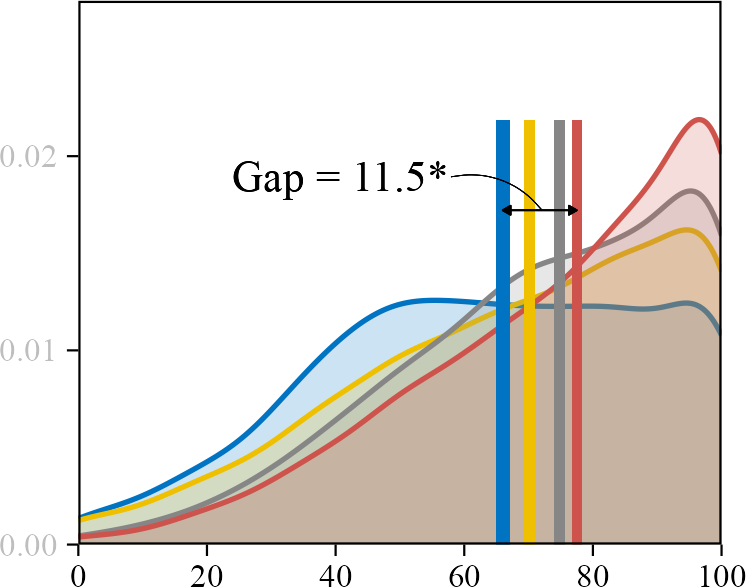
Politicians’ gender and age
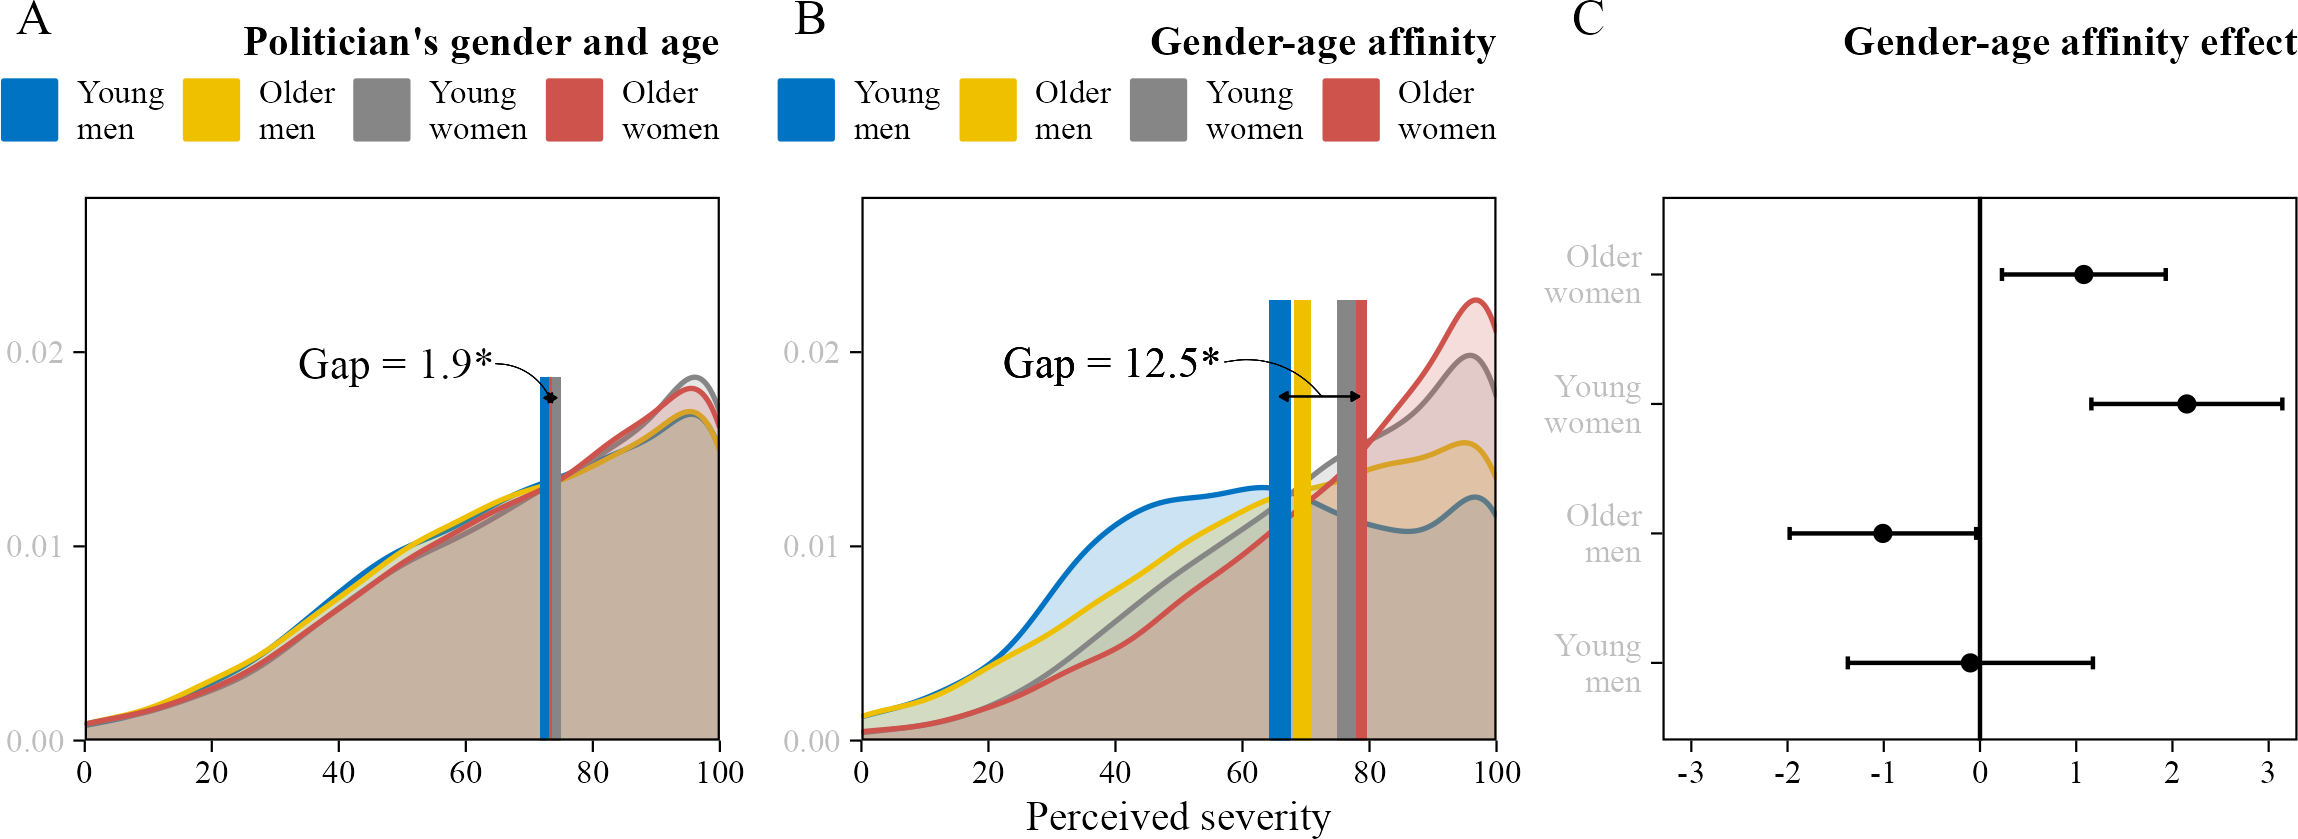

Political harassment is perceived as less severe …

  • H3: when the targeted politician is a man

  • H4: when the targeted politician is an older person

  • H5: by people who belong to a different (gender-age) group than the targeted politician

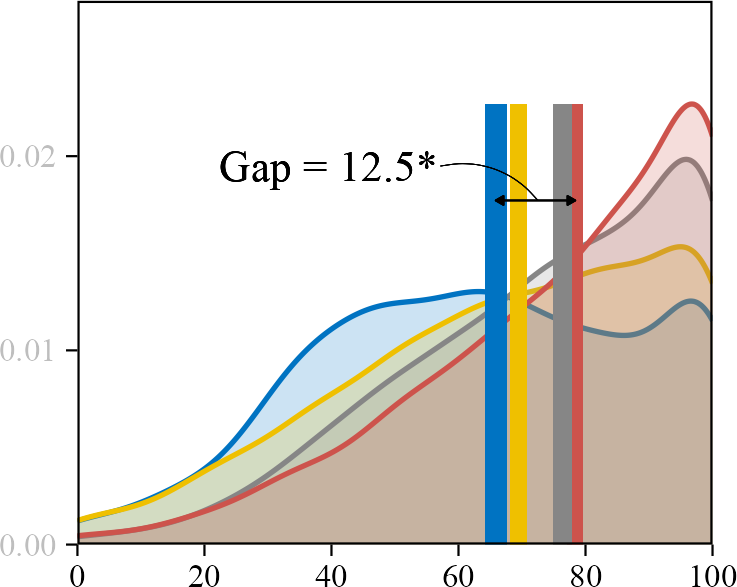
Politicians’ gender and age


Full sample

Affinity subset
(~25%)

Politicians’ gender and age


  • Women politician:
    slightly more severe
    (young women, H3 +)
  • Young politician:
    no gap (H4 -)
  • Gender-age affinity:
    • worse for women (H5 +)
    • less for older men (H5 -)
    • driven by perceptions for
      women politicians (H3)

Political ideology
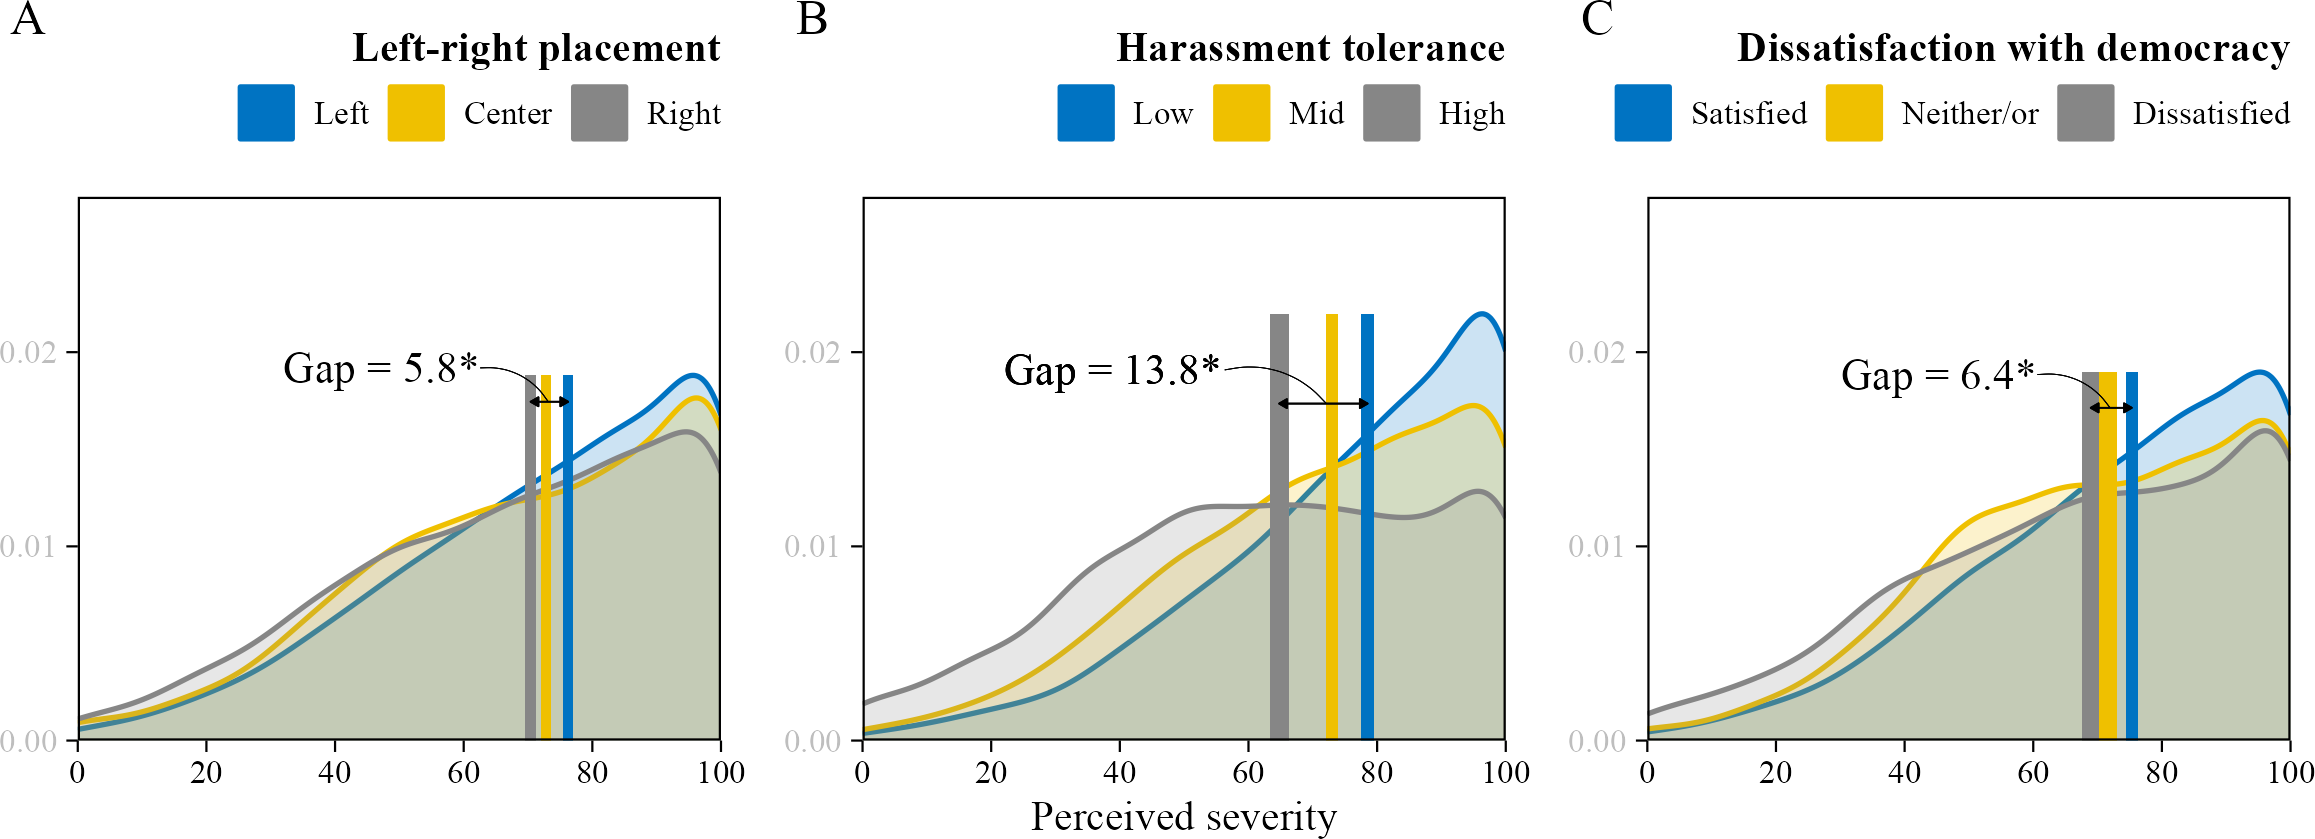

Political harassment is perceived as less severe …

  • H6: by people who identify as ideologically right-leaning (27%)

  • H7: by people who are generally more tolerant of harassment in politics (18%)

  • H8: by people who are dissatisfied with democracy (31%)

    • viscous cycle:

      • dissatisfaction → low severity perceptions → more harassment → degraded representation → dissatisfaction

Political ideology


Political ideology


Lower perceived severity if the respondent:

  • leans right (H6 +)
  • generally tolerates harassment (H7 +)
  • is dissatisfied with democracy (H8 +)

Harassment type
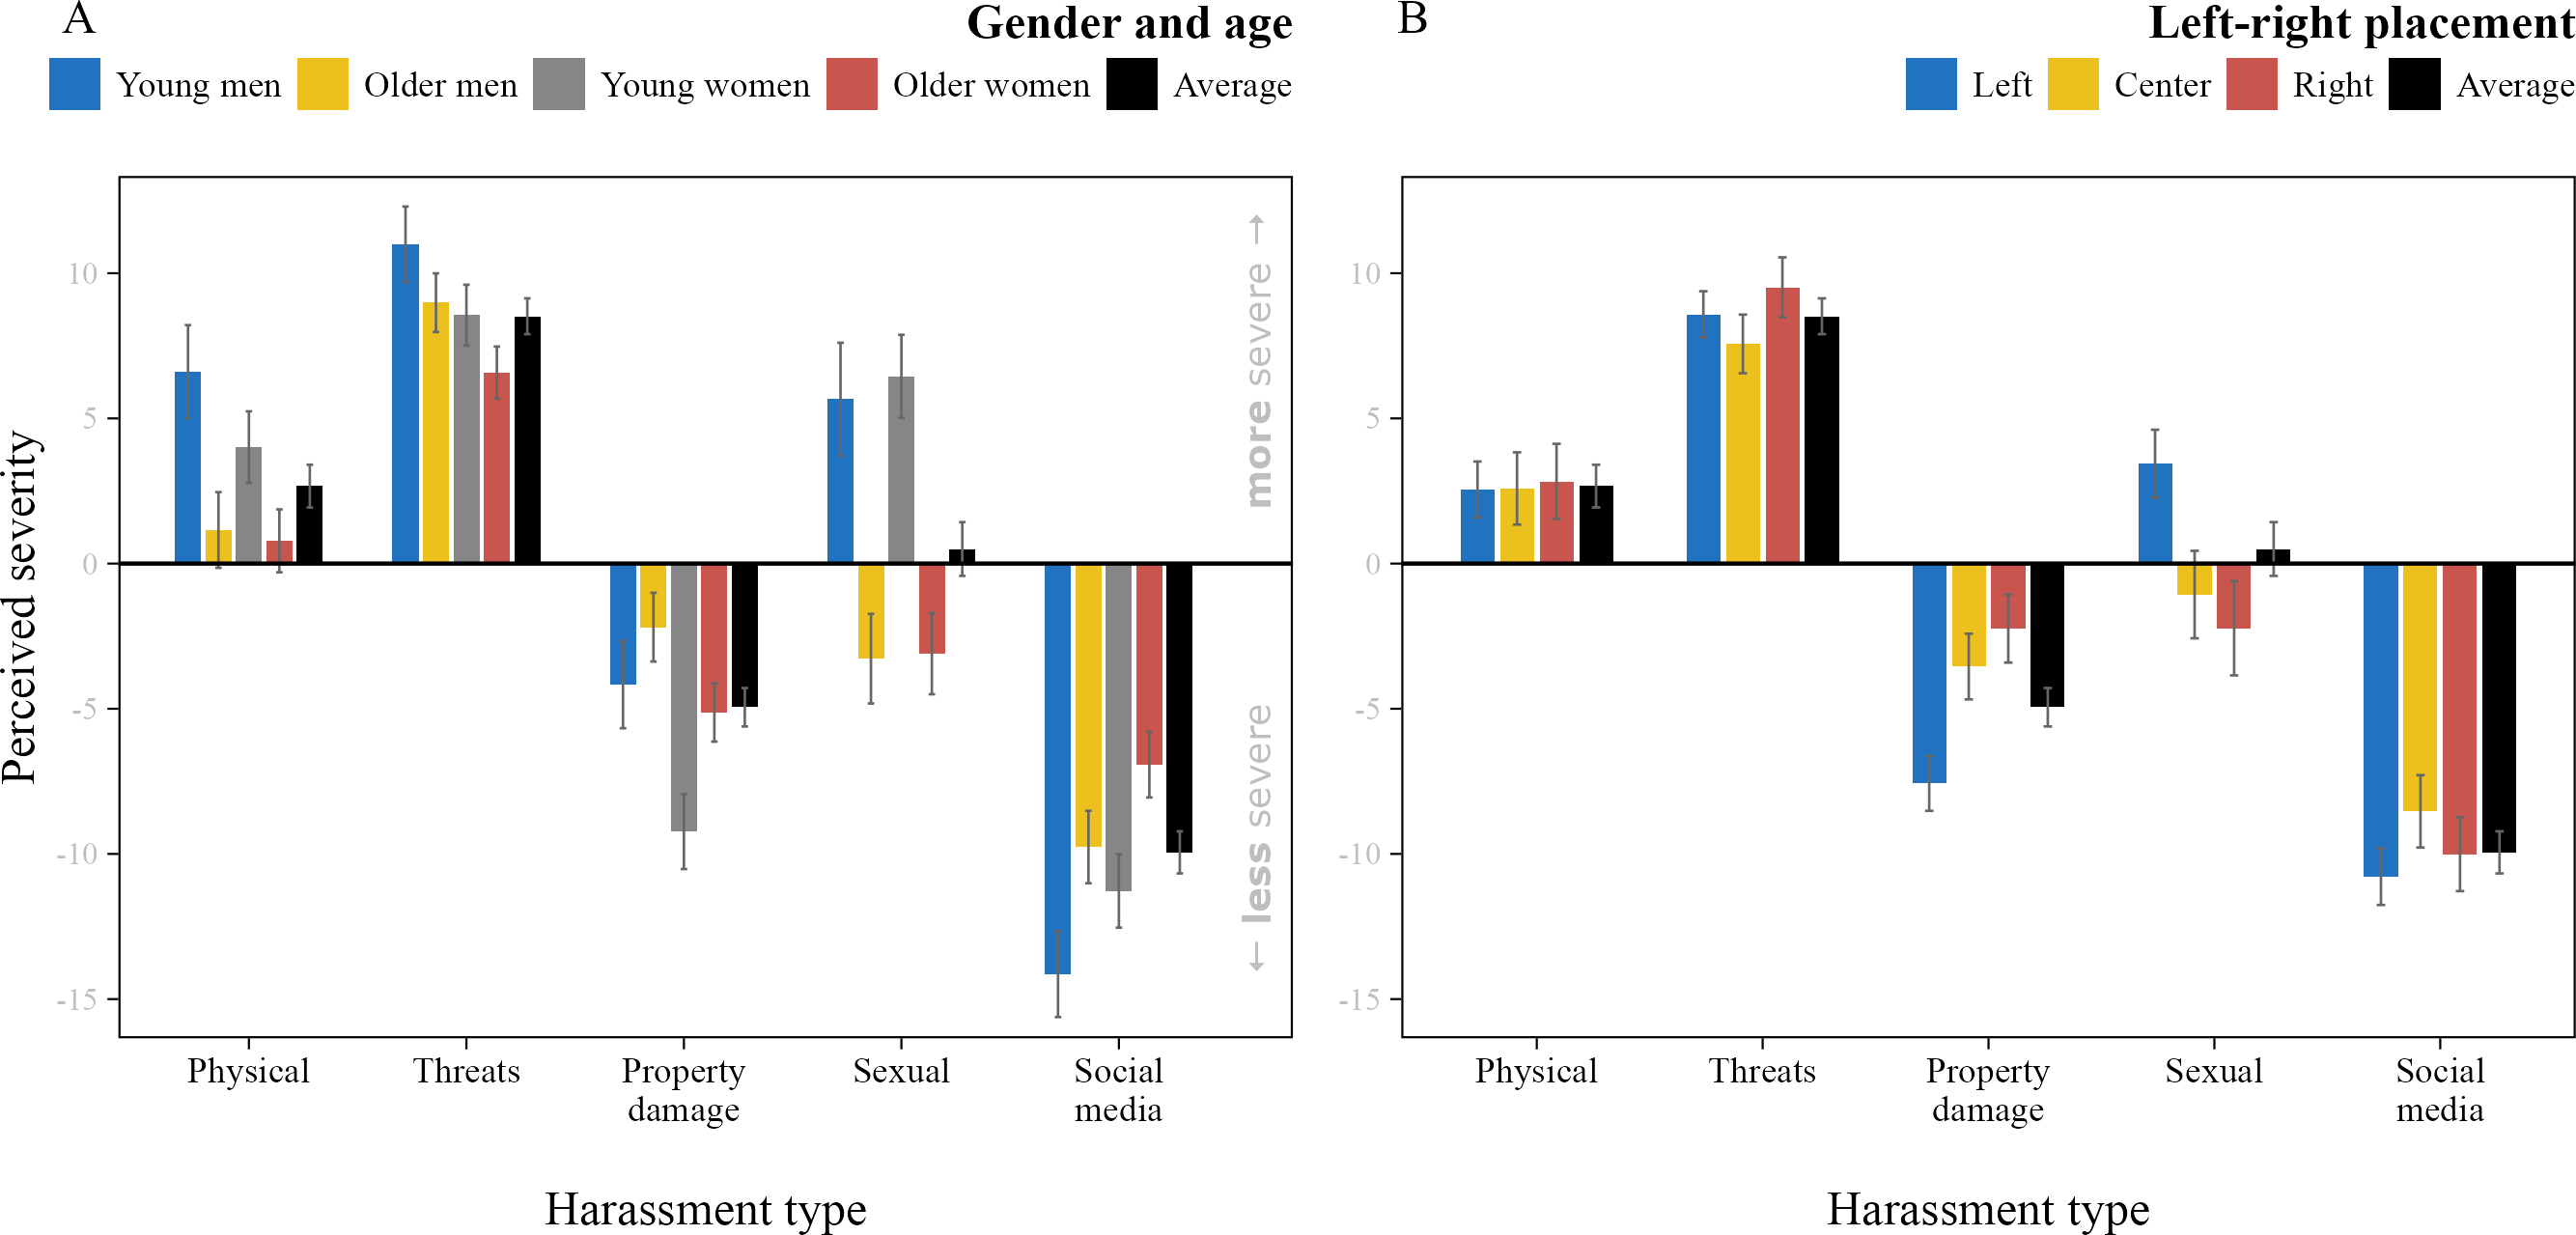

  • Explorative analysis of five harassment types (vs. rest)
    1. physical harassment
    2. threats of violence
    3. property damage
    4. sexual harassment
    5. social media (online arena)
  • Total and by:
    • gender and age
    • left-right placement

Harassment type


Harassment type


  • Physical and threats:
    higher severity
    • stronger norm for young men
    • no ideological gap
  • Property damage:
    lower severity
    • especially the left and young women

Harassment type


Harassment type


  • Sexual: same severity
    • only polarizing issue:
    • higher among young people and on the left
    • lower among older people and on the right
  • SoMe: much lower severity
    • stronger norm among
      young men
    • no ideological gap

Conclusion

  • We asked how citizens perceive the severity of harassment against politicians
  • To address the broader question: Is political violence/harassment becoming more accepted?
  • We designed a large survey with real(istic) stories of harassment
  • Results: high severity perceptions overall → rejection of violence/harassment
    • important, sometimes large perception gaps
    • some expected (e.g., gender, ideology, threats)
    • others unexpected (e.g., age, gender-age affinity, sexual)
  • Should pay attention to groups with low perceptions
    (e.g., young men, the right, democratically dissatisfied)

Thank you

Extra

Flowchart