Political Weather:
How experiencing climate change shapes our political lives
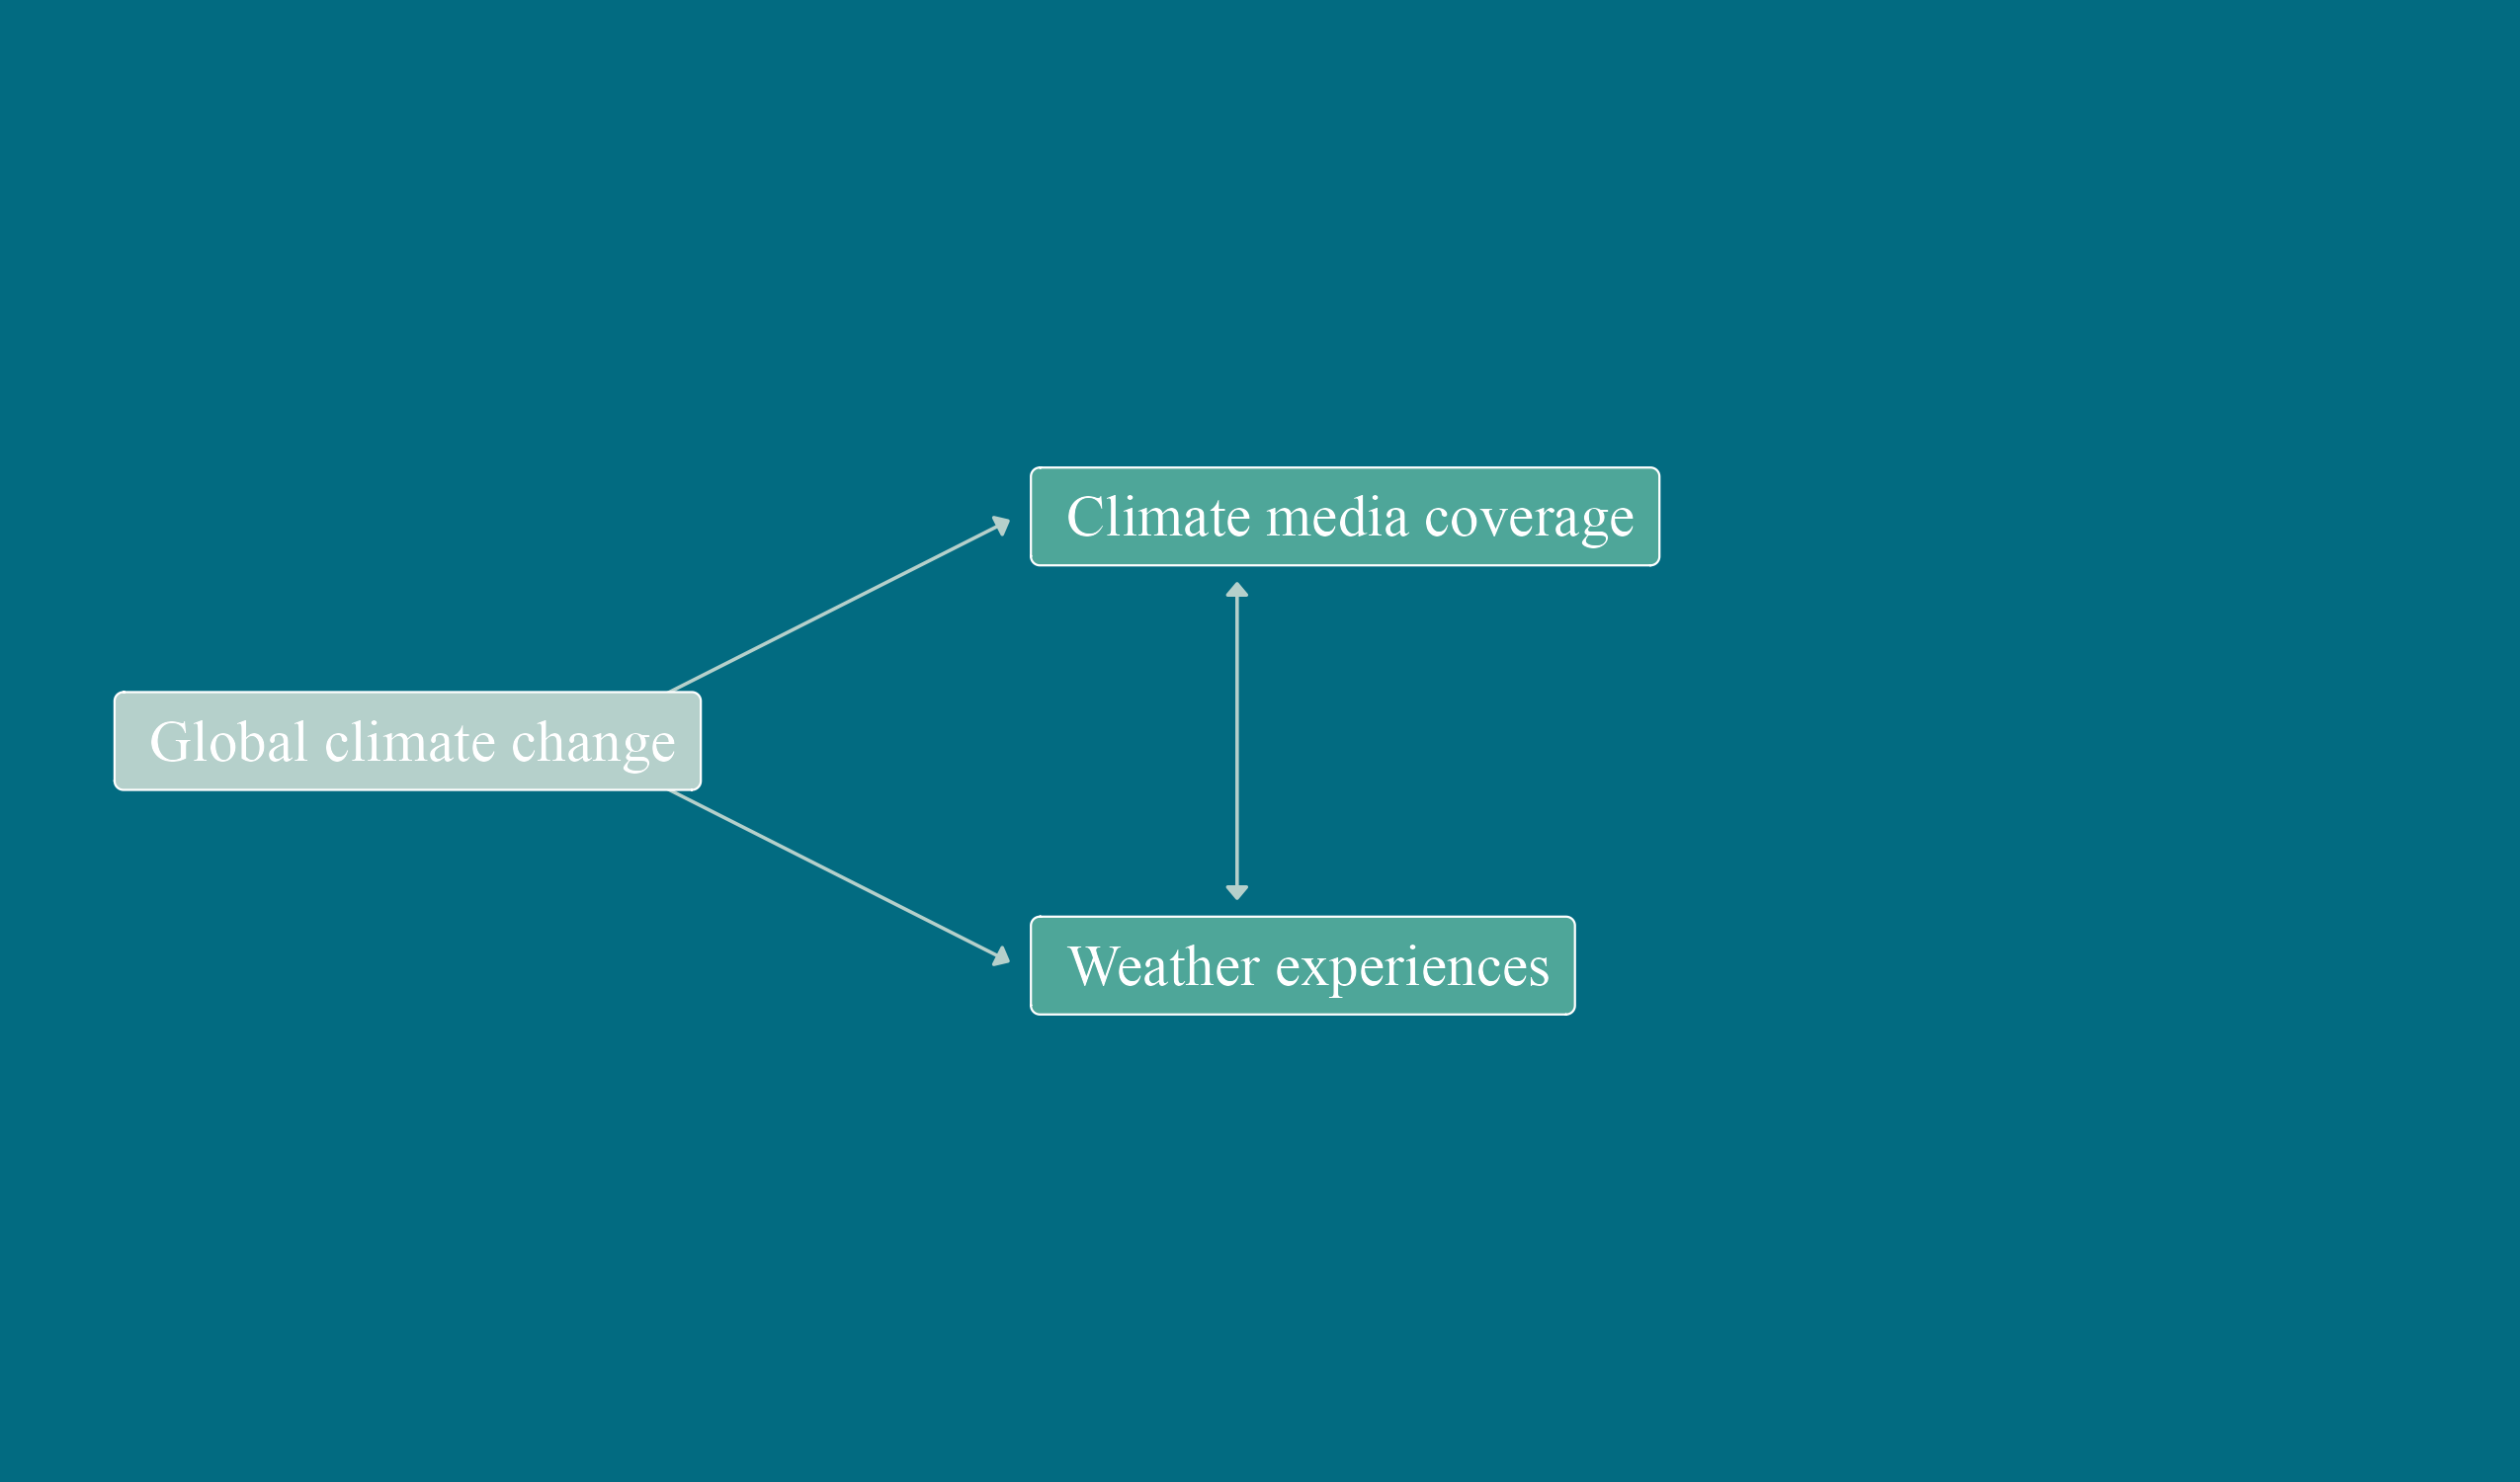
There is another way of learning about climate change
- Easier, concrete, immediate, and visceral
- Personal experience

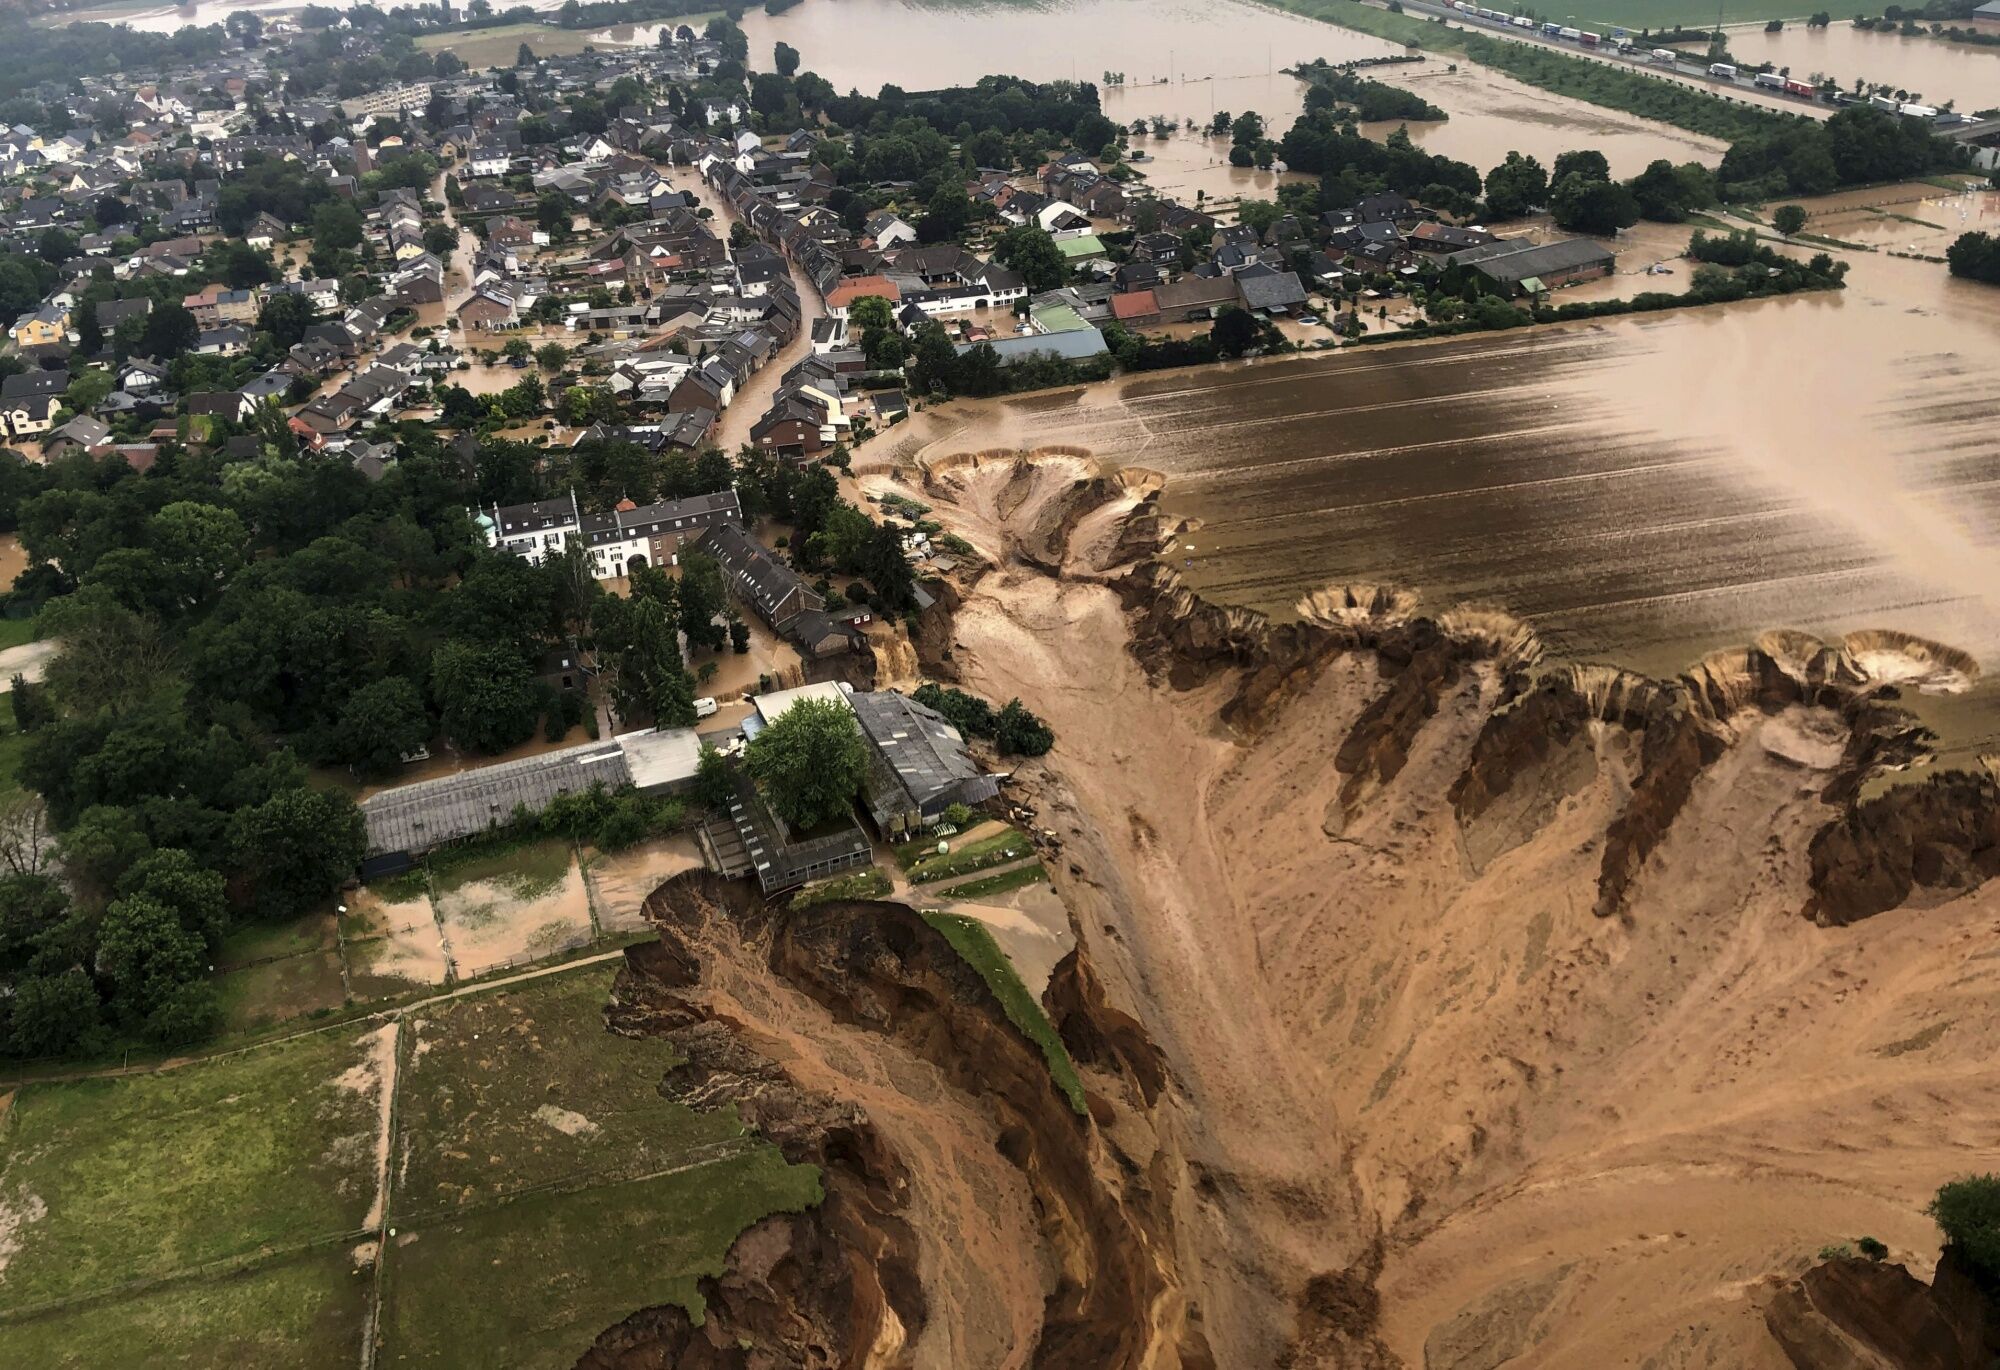
Christophe Gateau/AFP/Getty Images, Josh Edelson/AFP, Patrick T Fallon/AFP/Getty Images, EPA Photo, Rhein-Erft-Kreis/Cologne District Government/AP Photo, Oli Scarff/AFP/Getty Images, AP Photo/Alvaro Barrientos, Jennifer Gauthier/Reuters, AP Photo/Rafael Yaghobzadeh
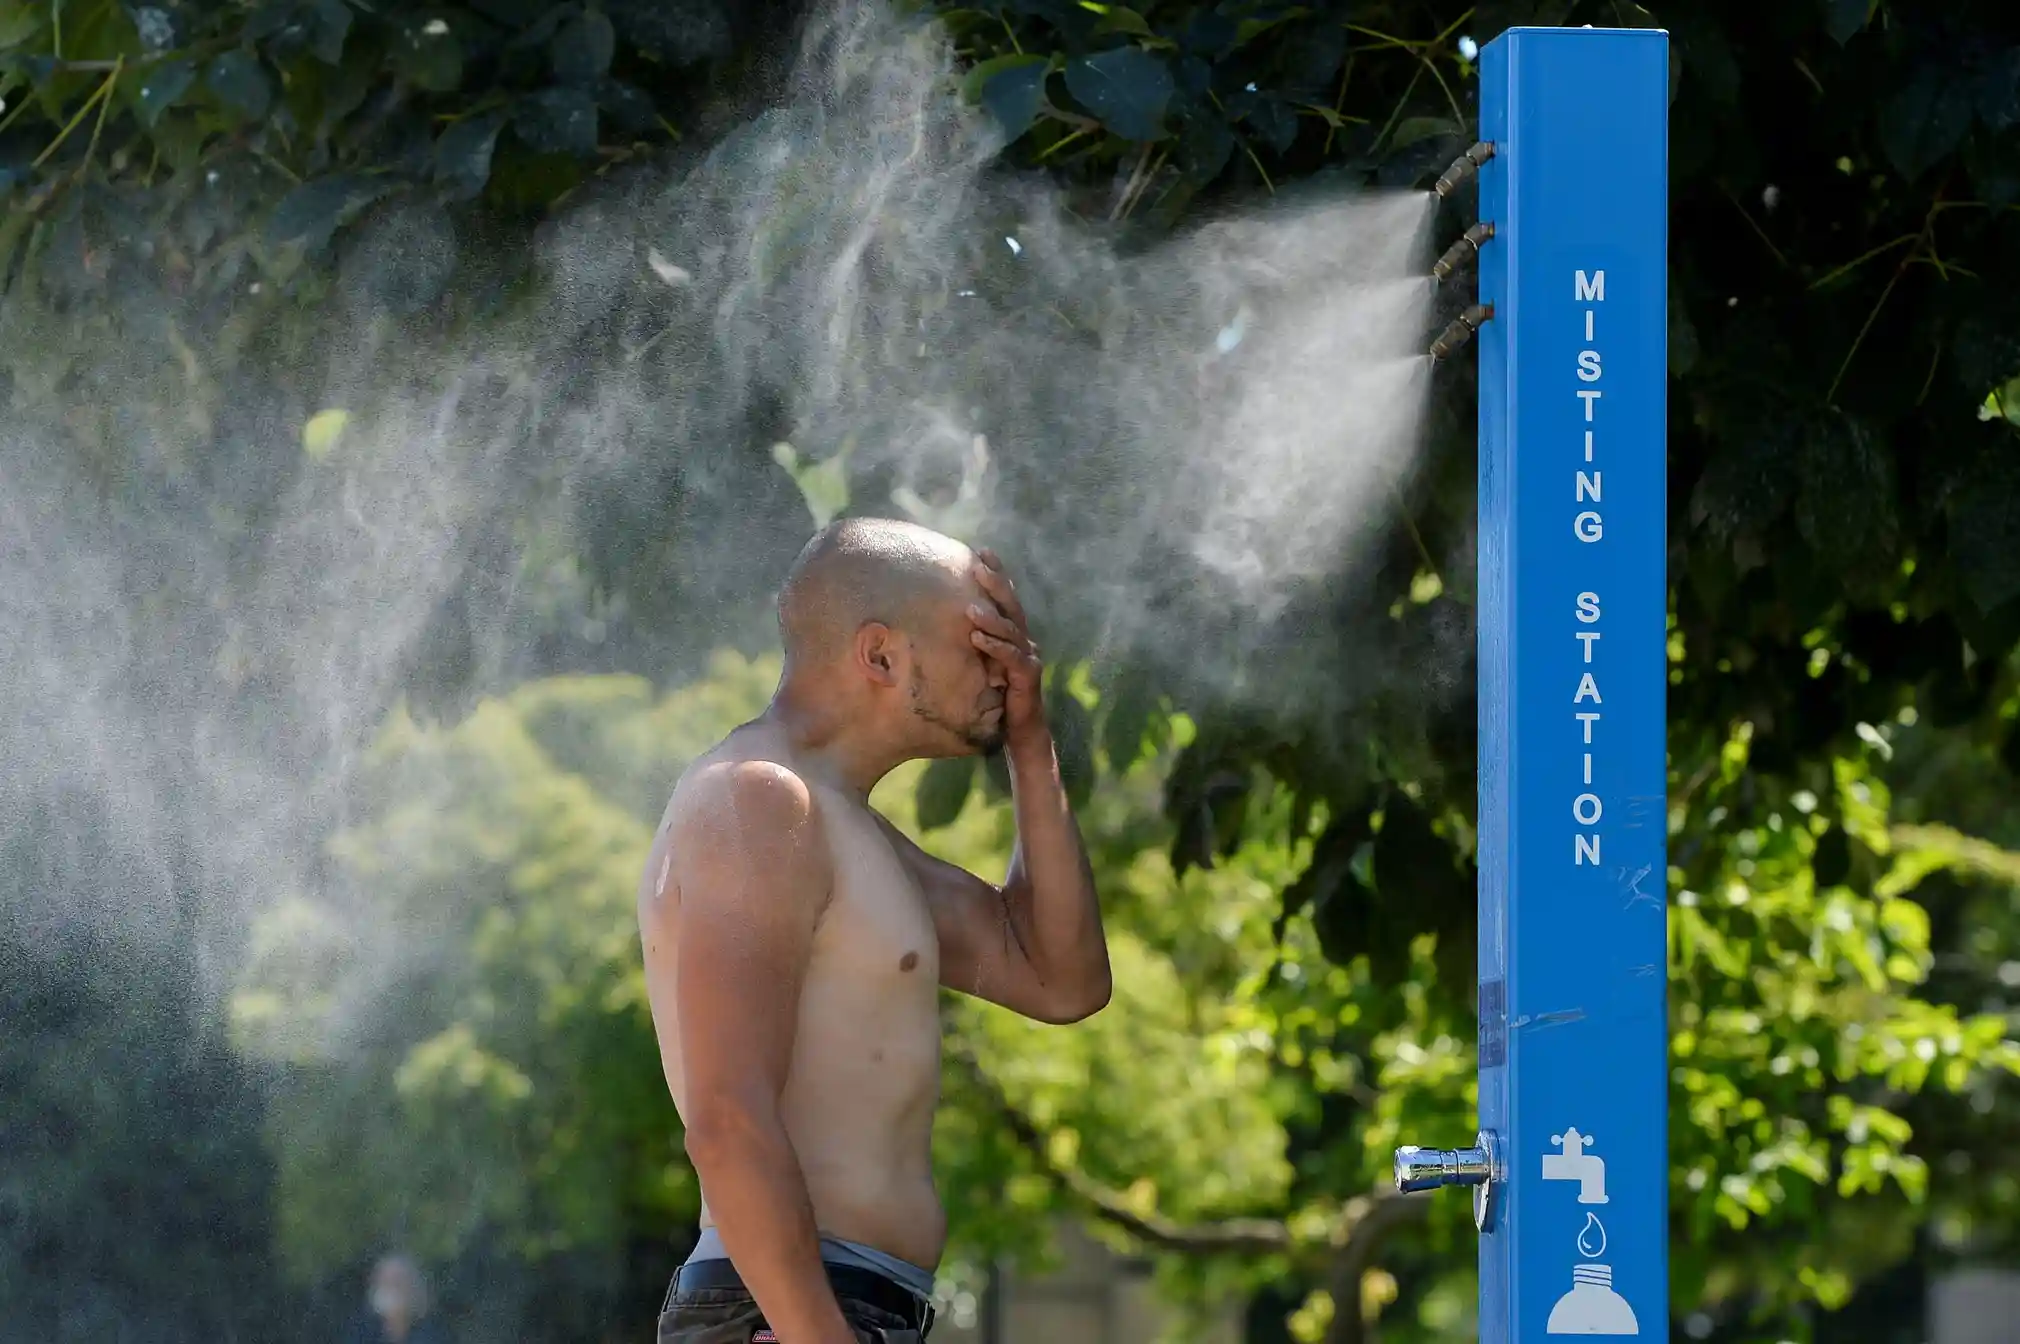
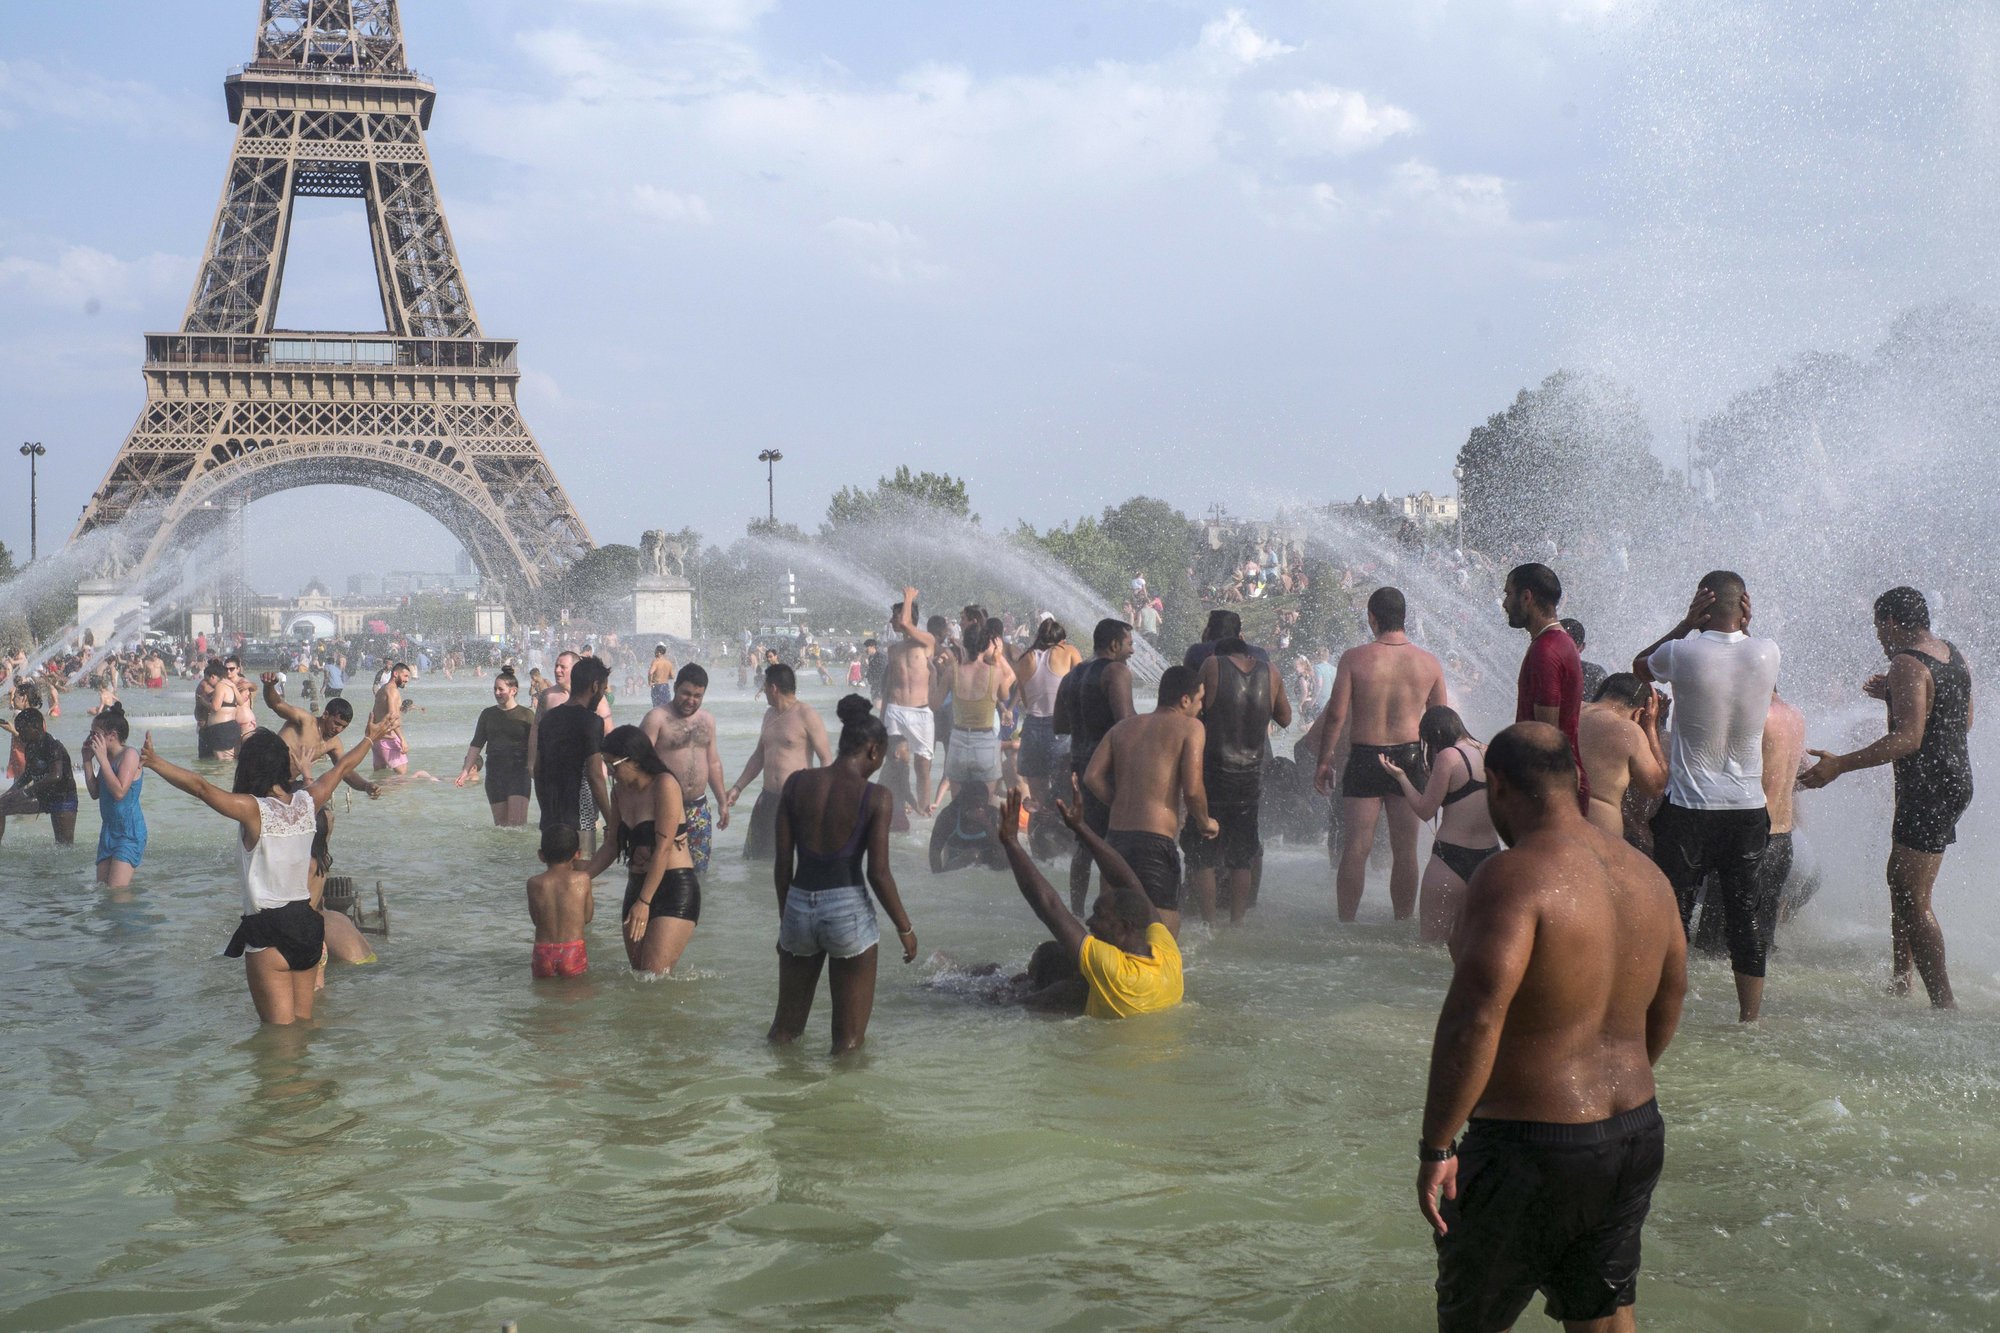
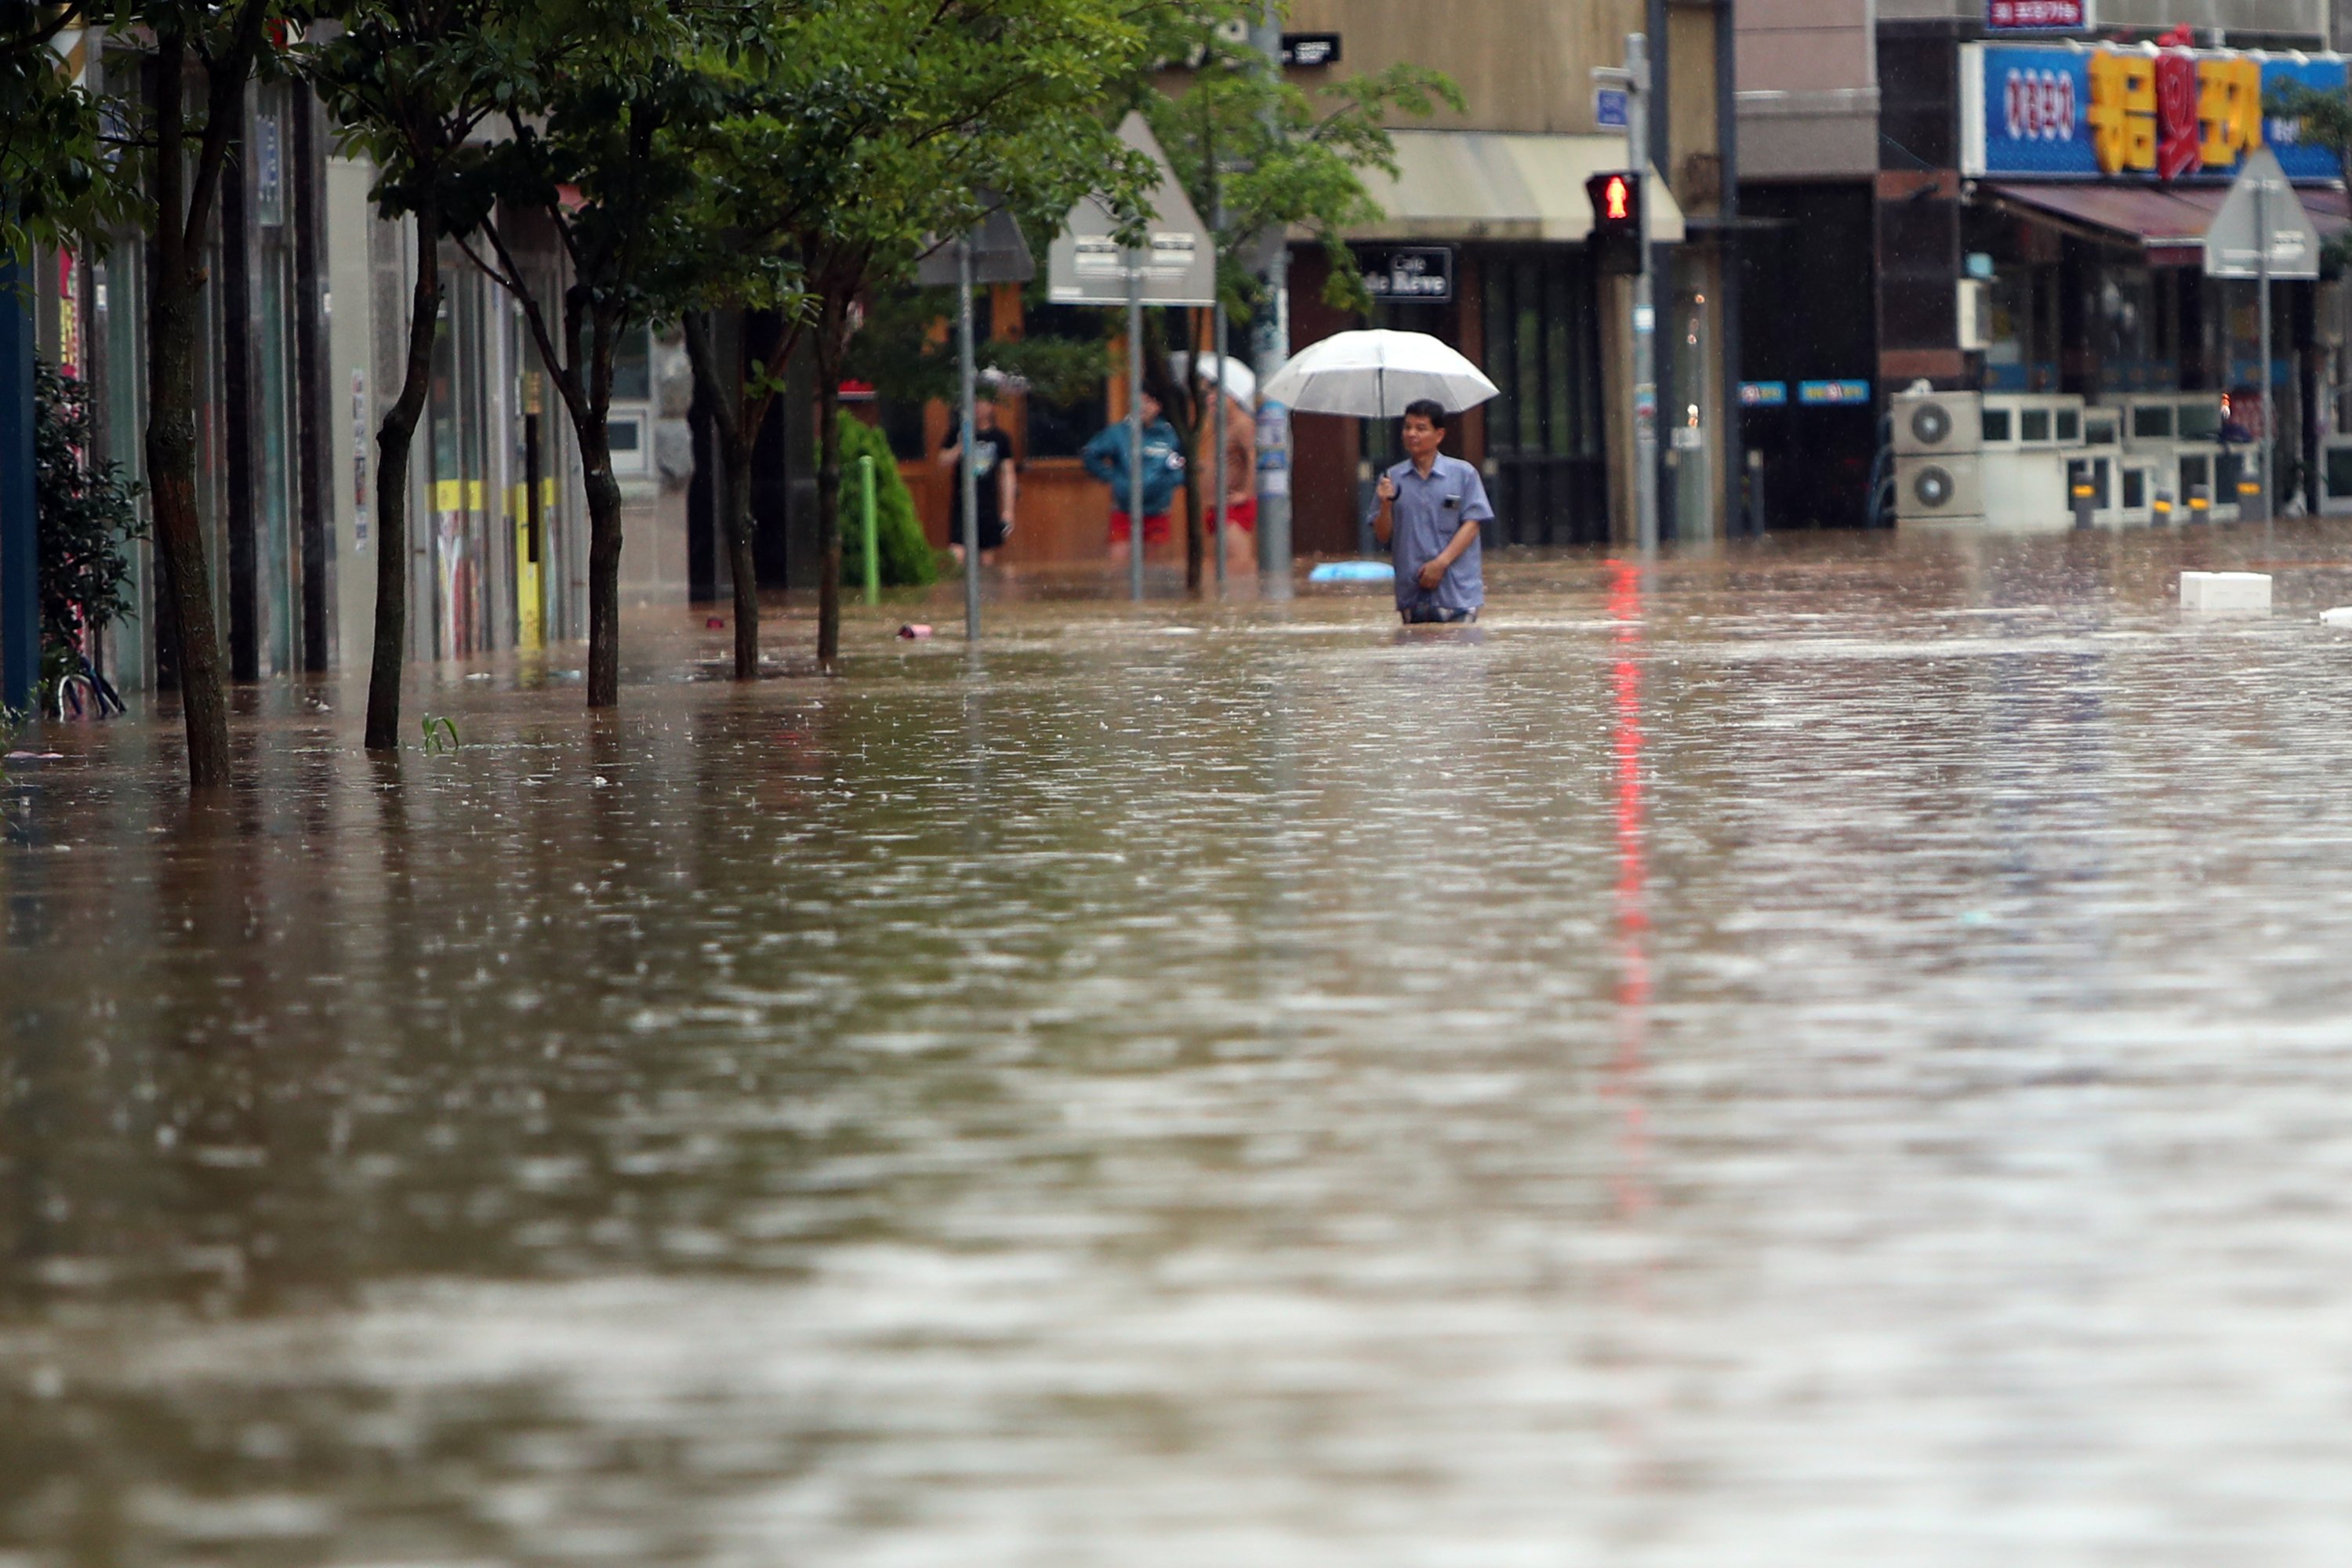
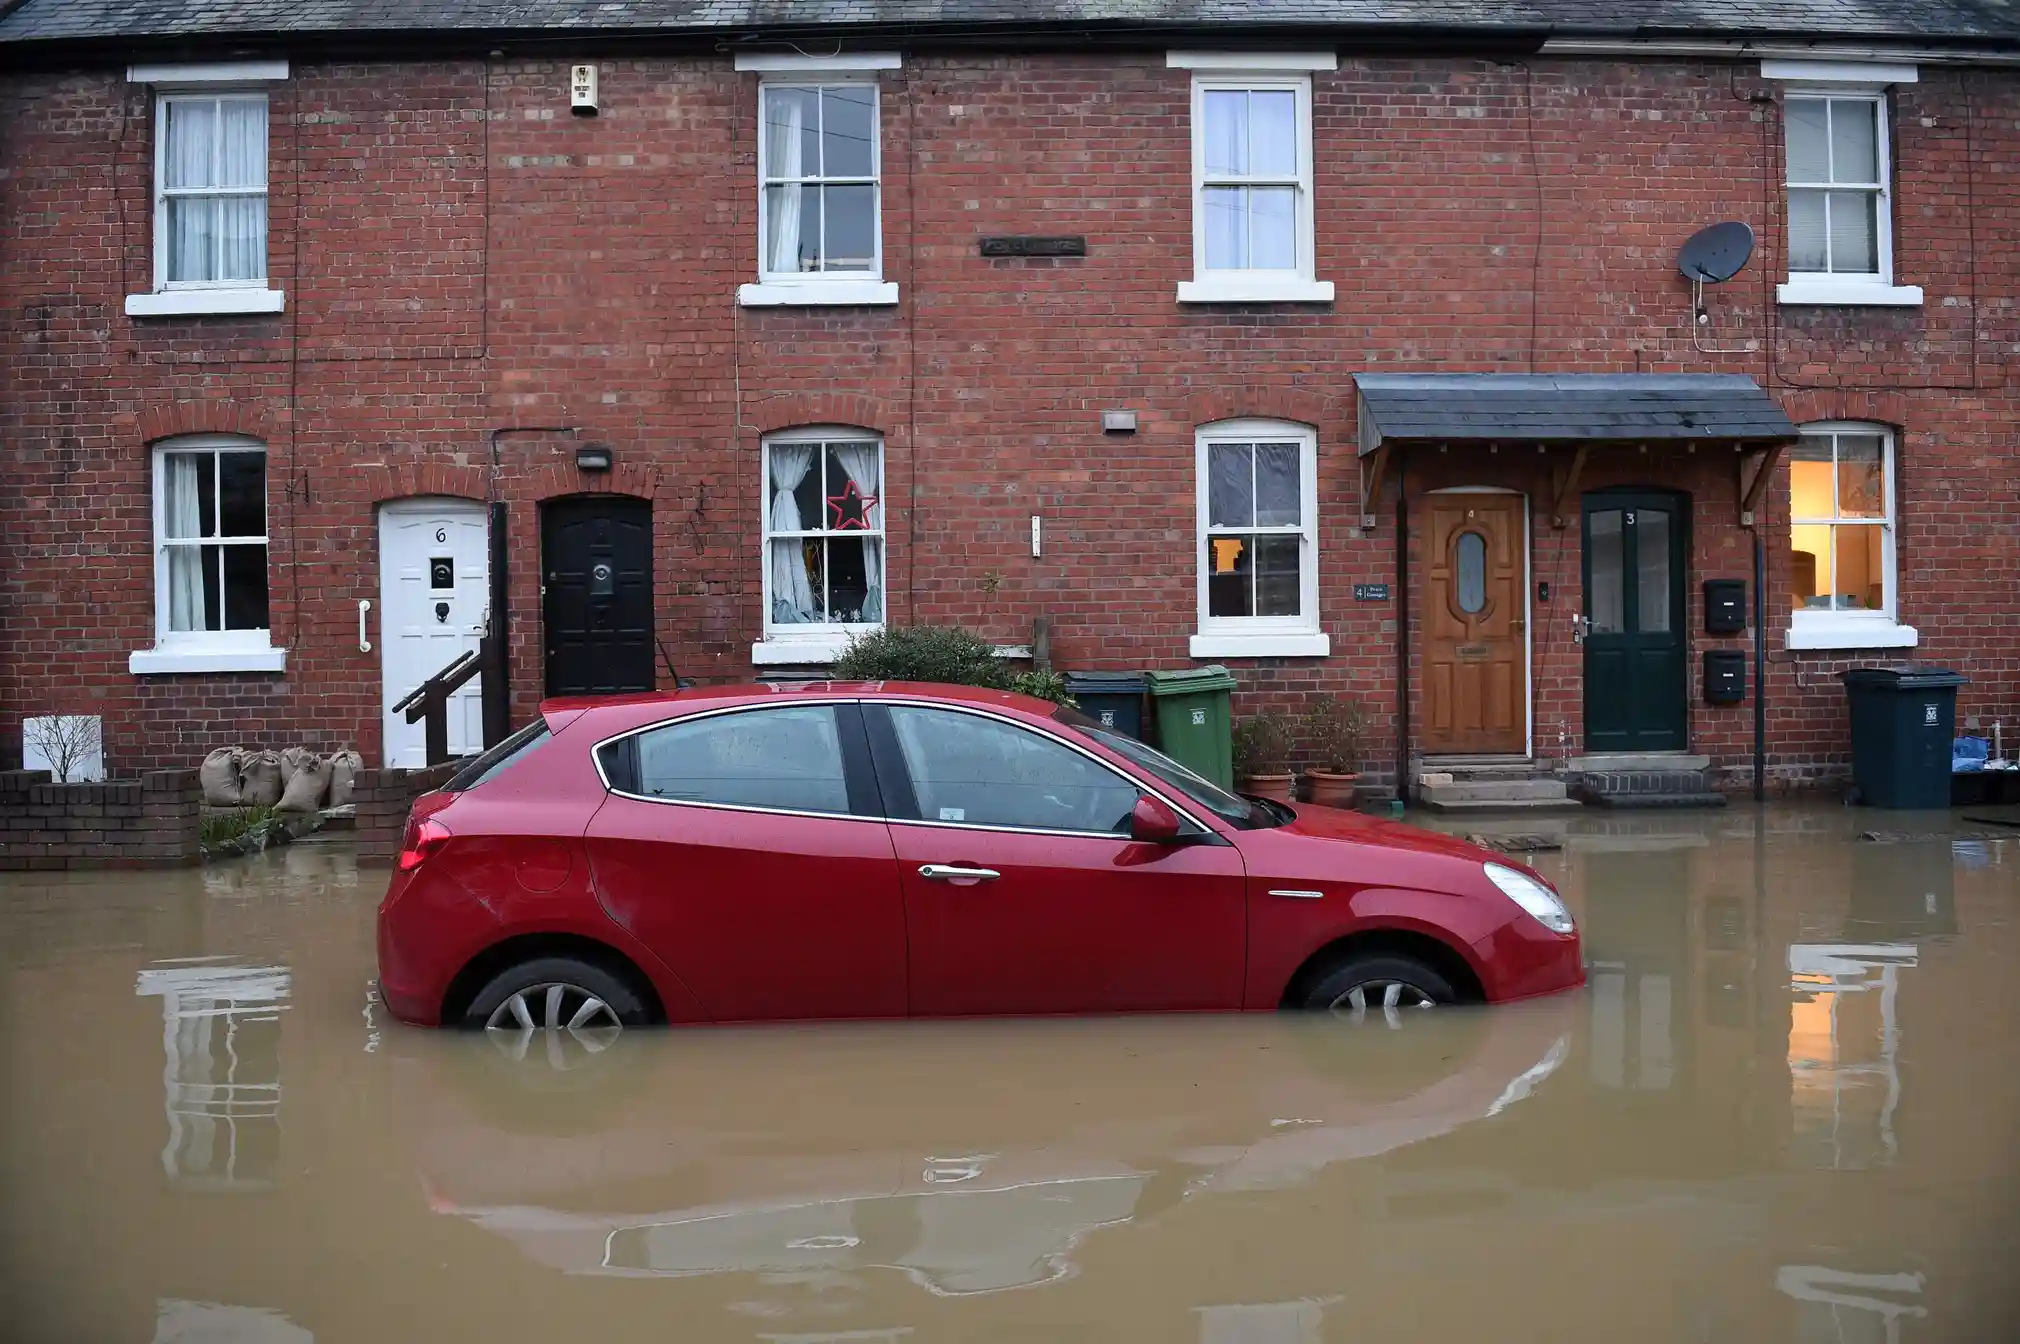
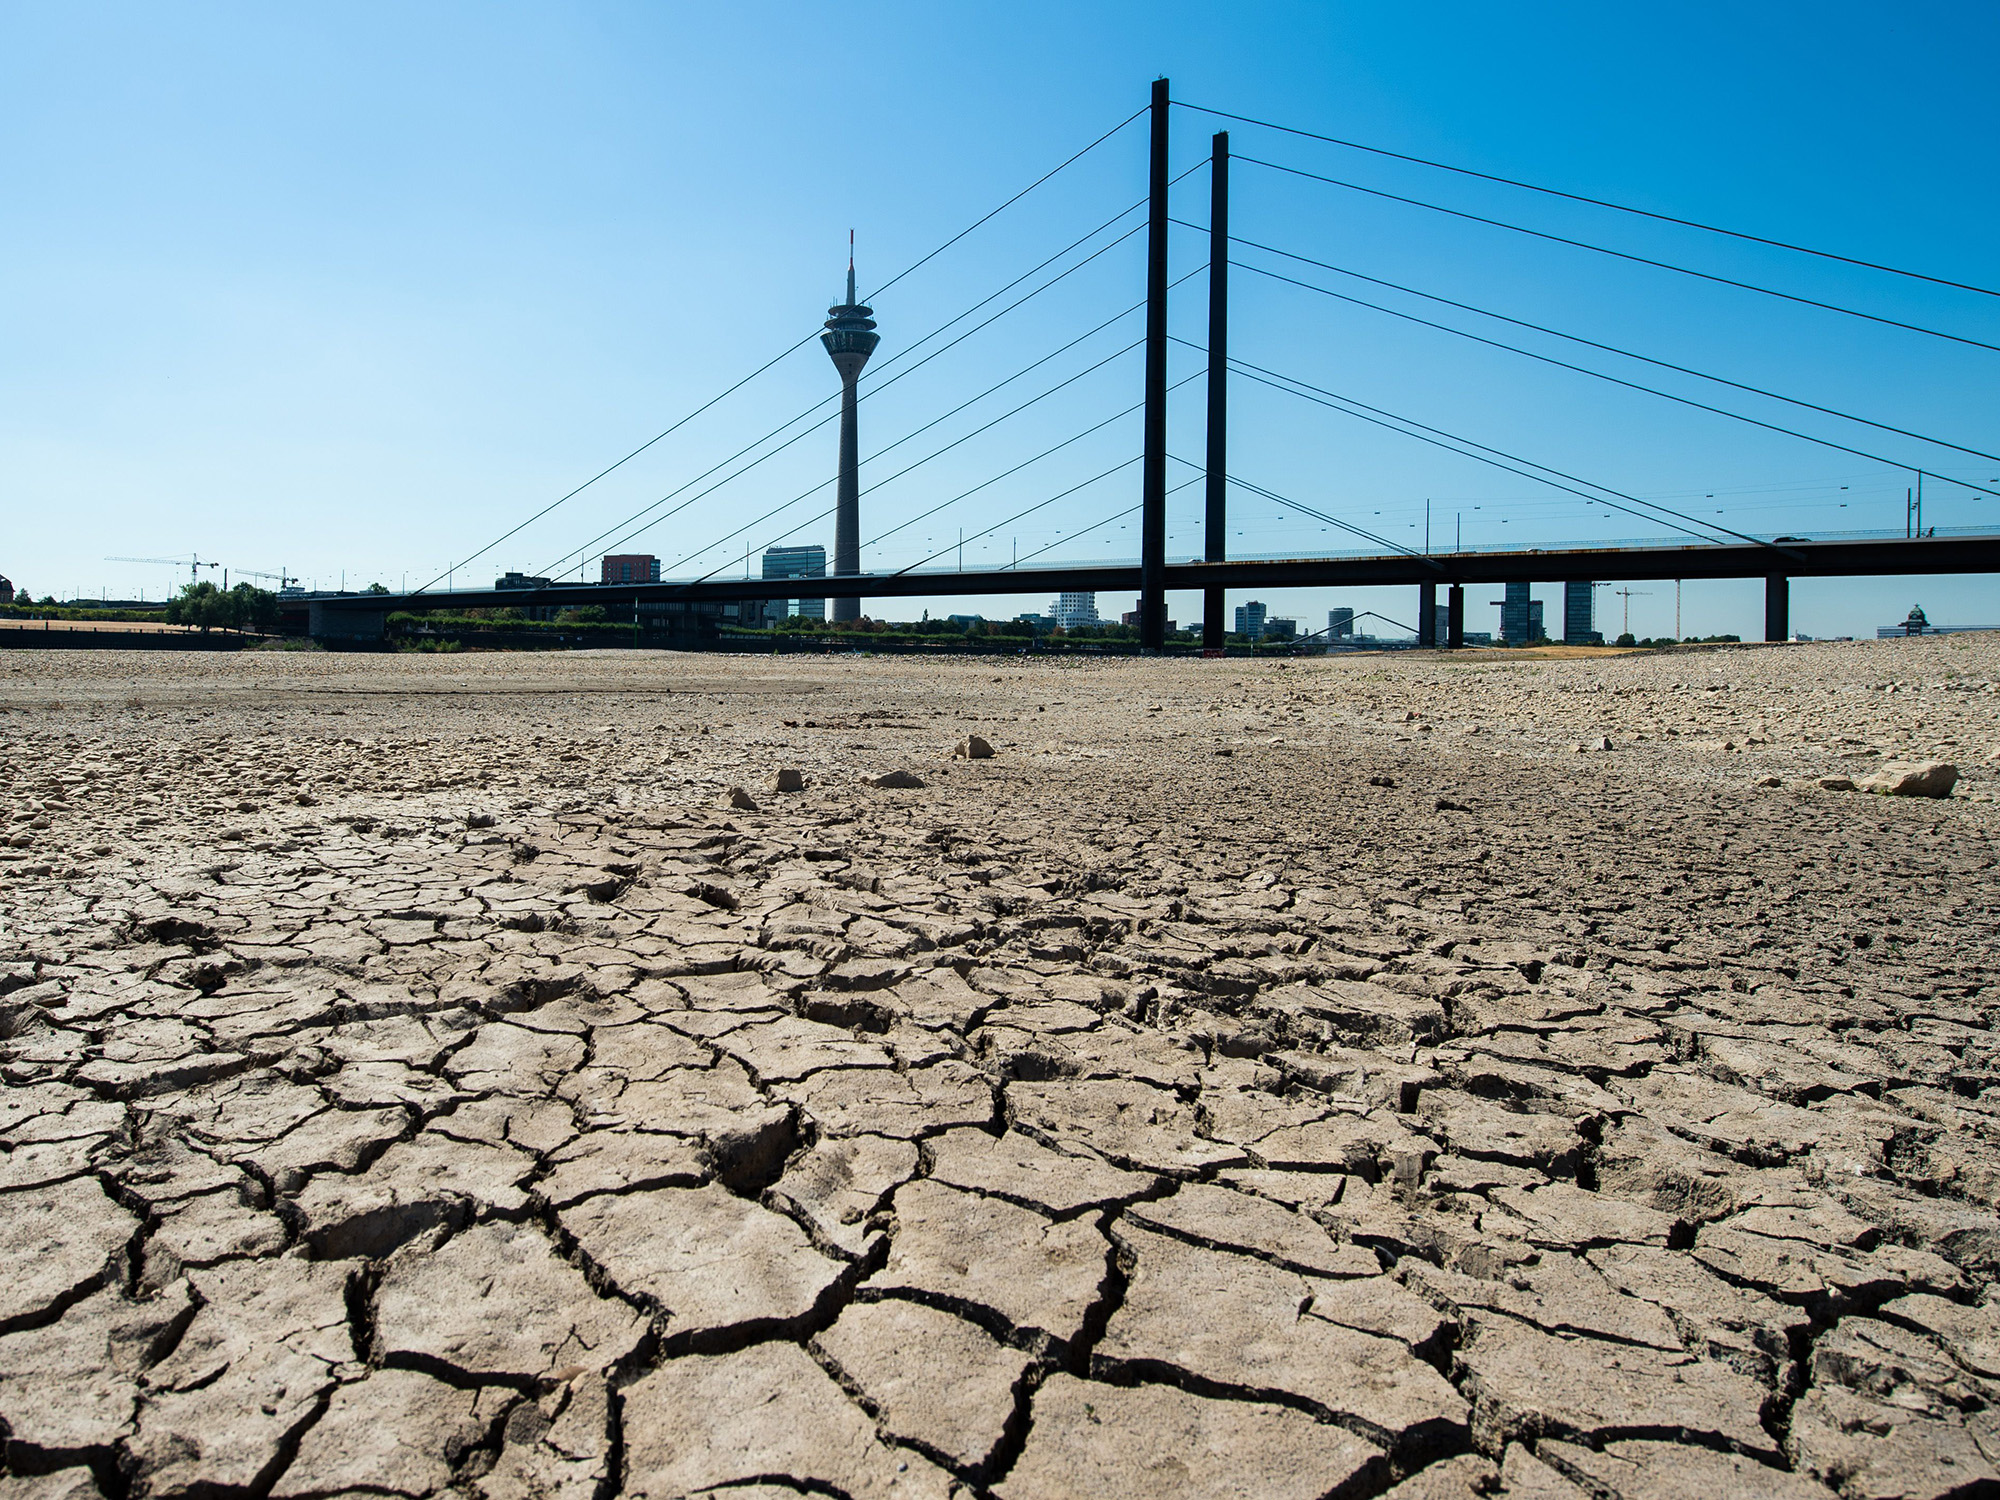
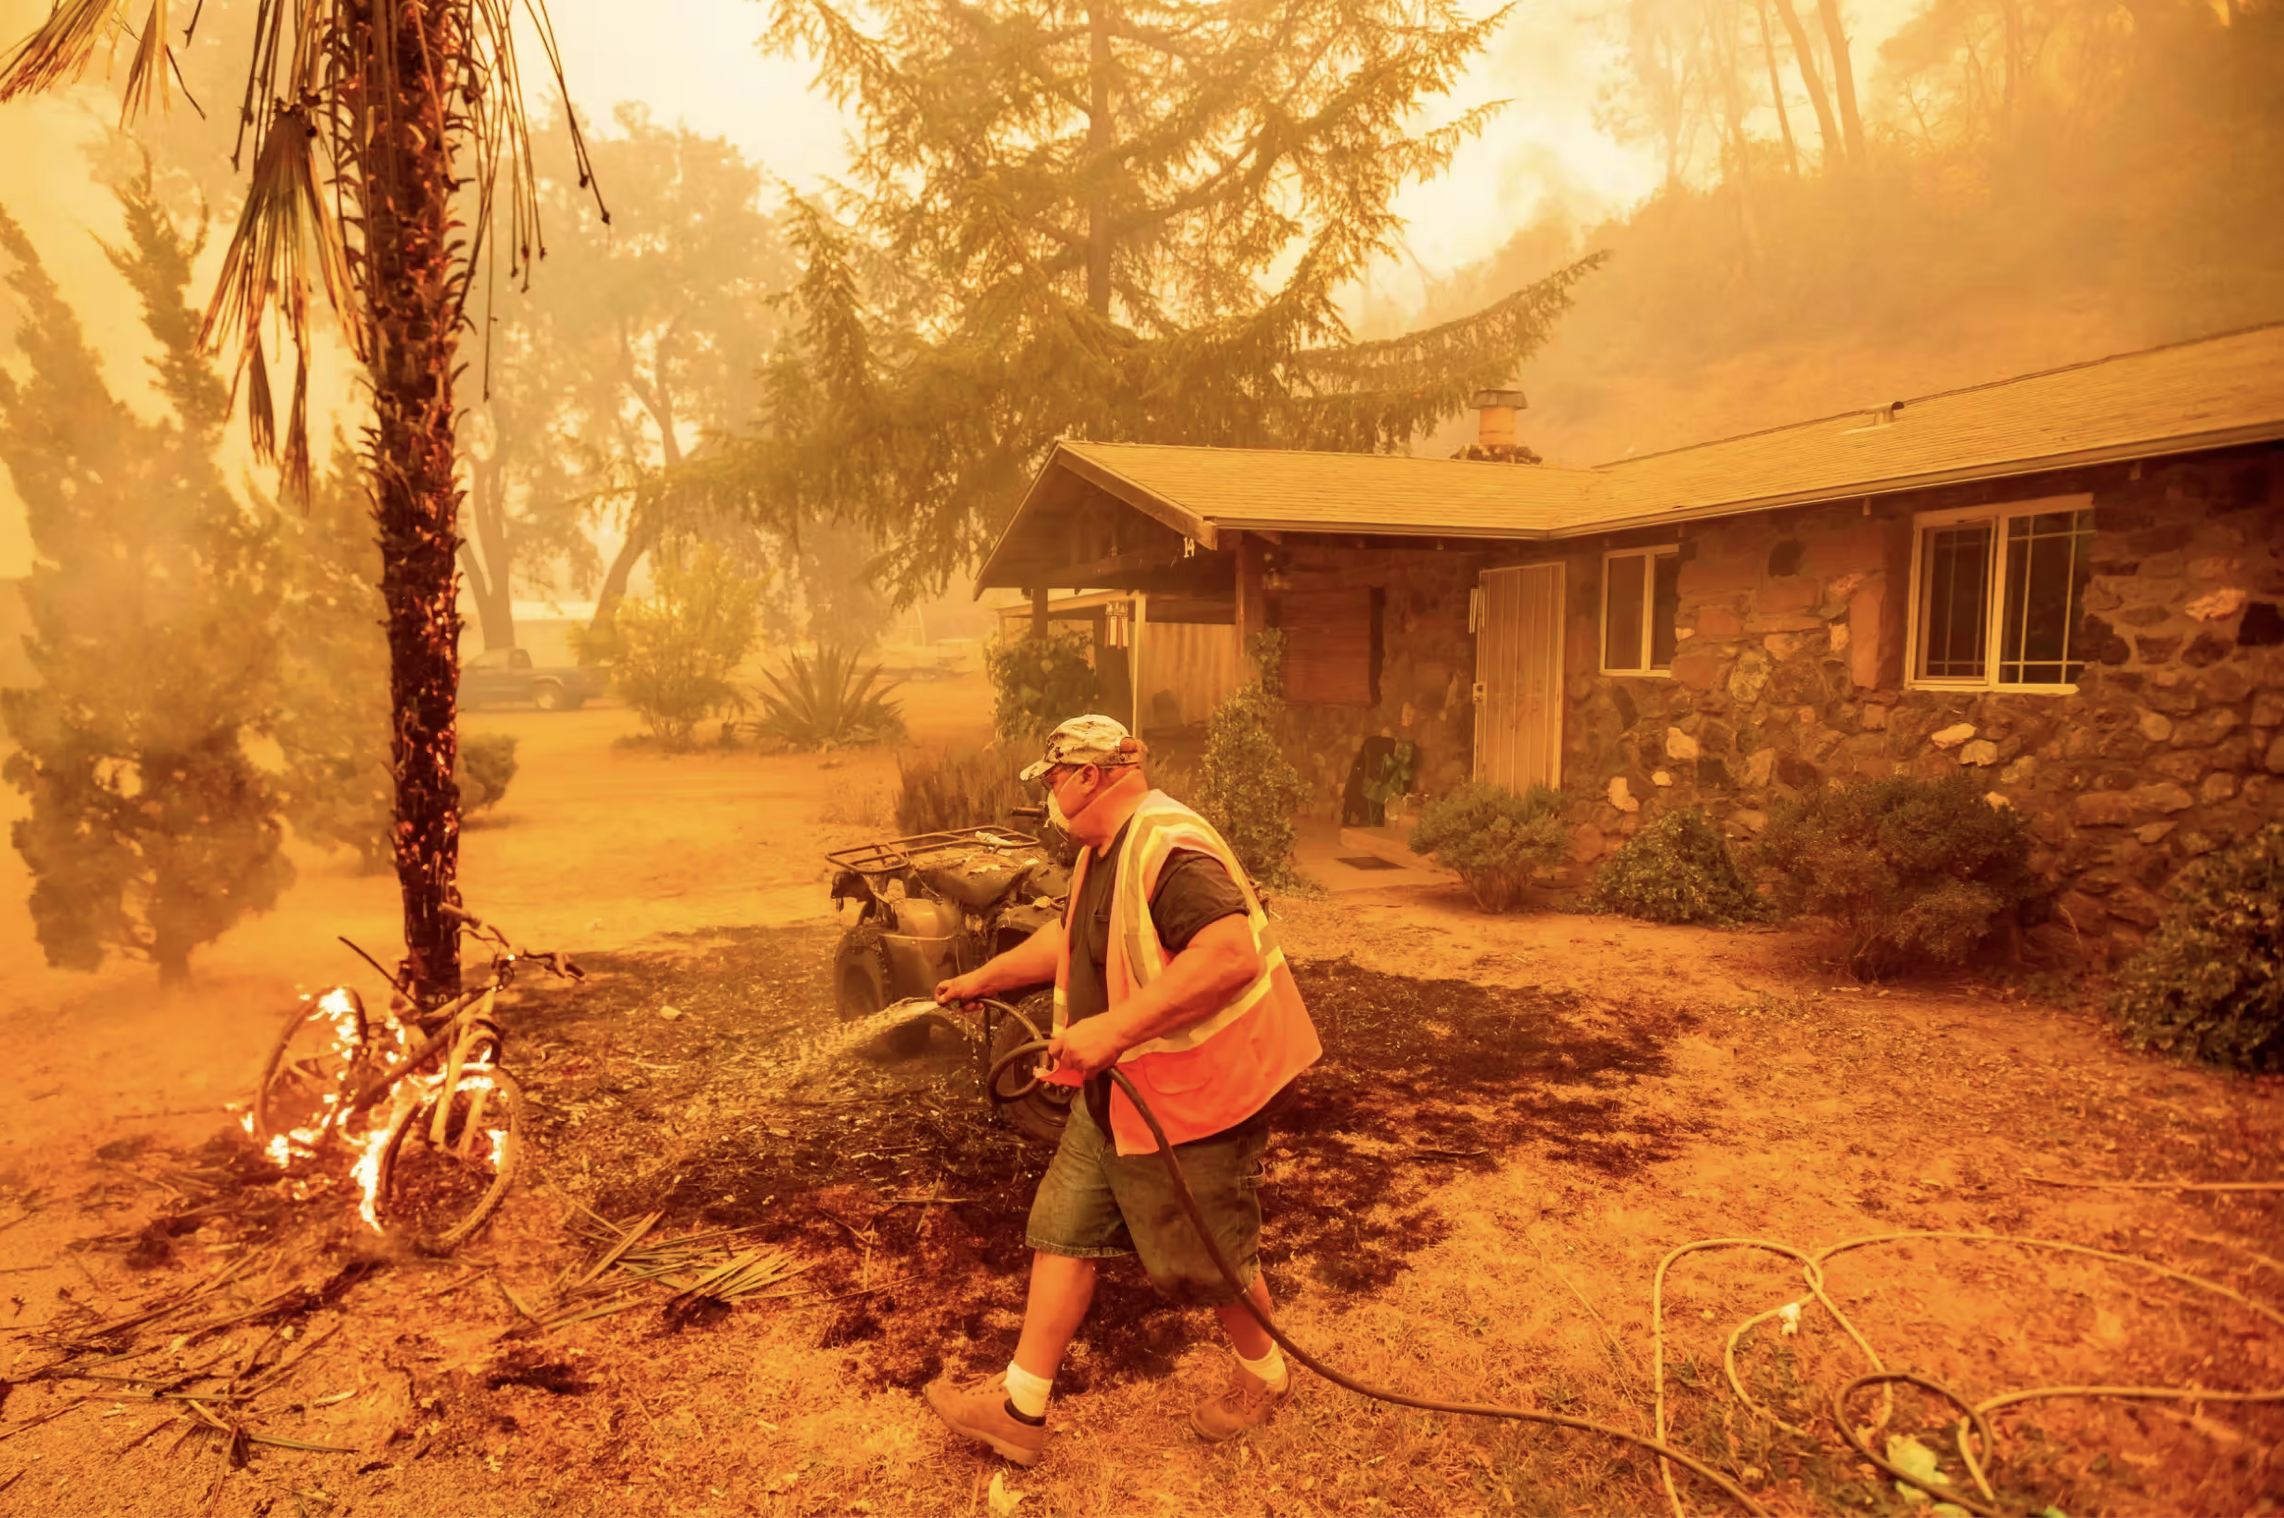
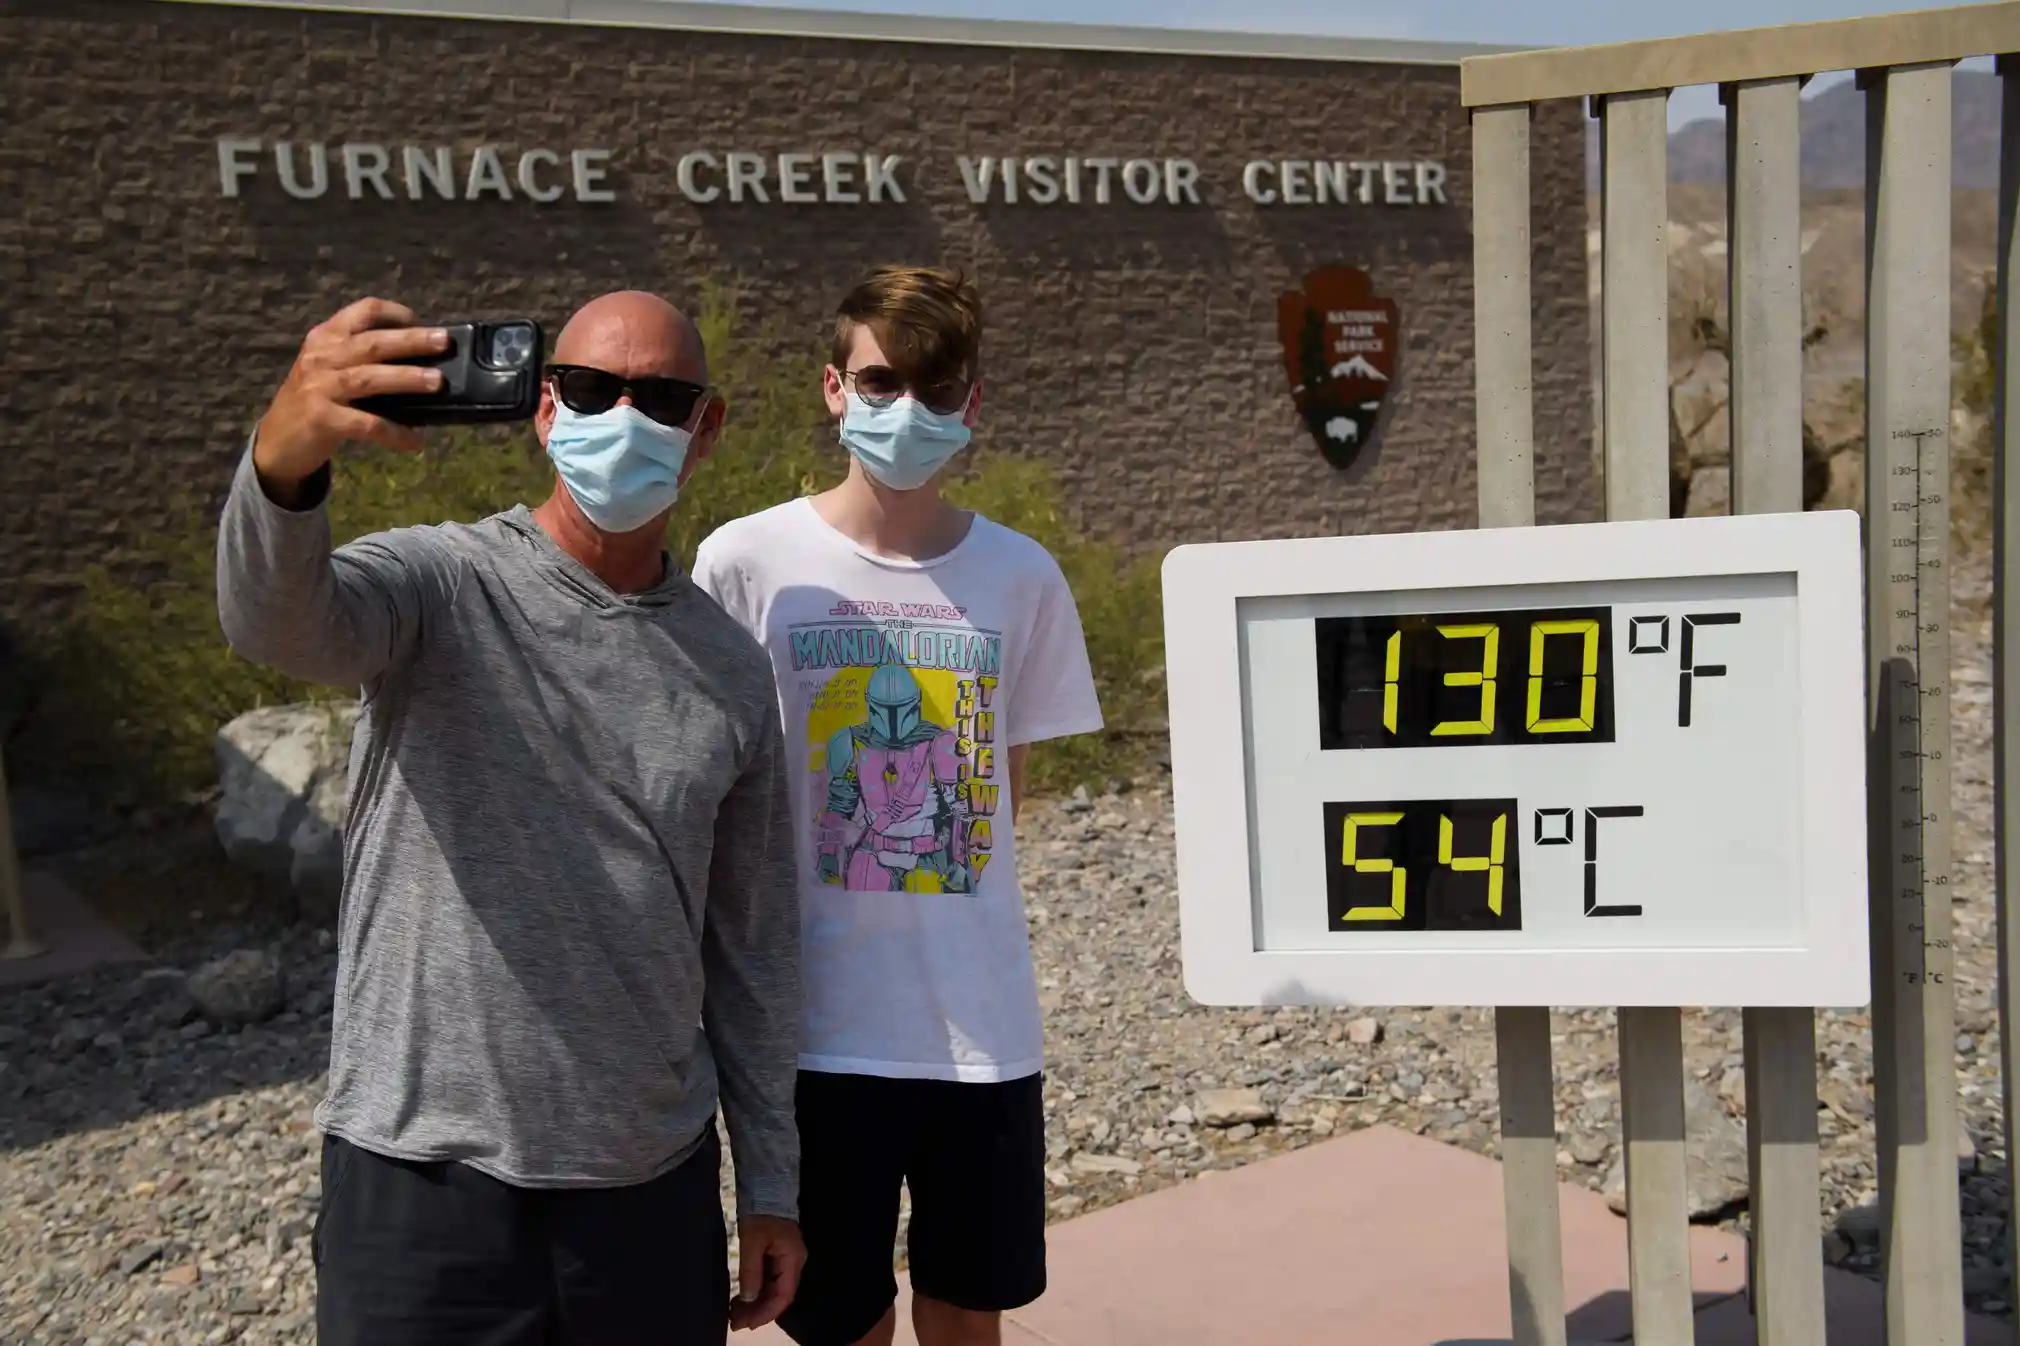
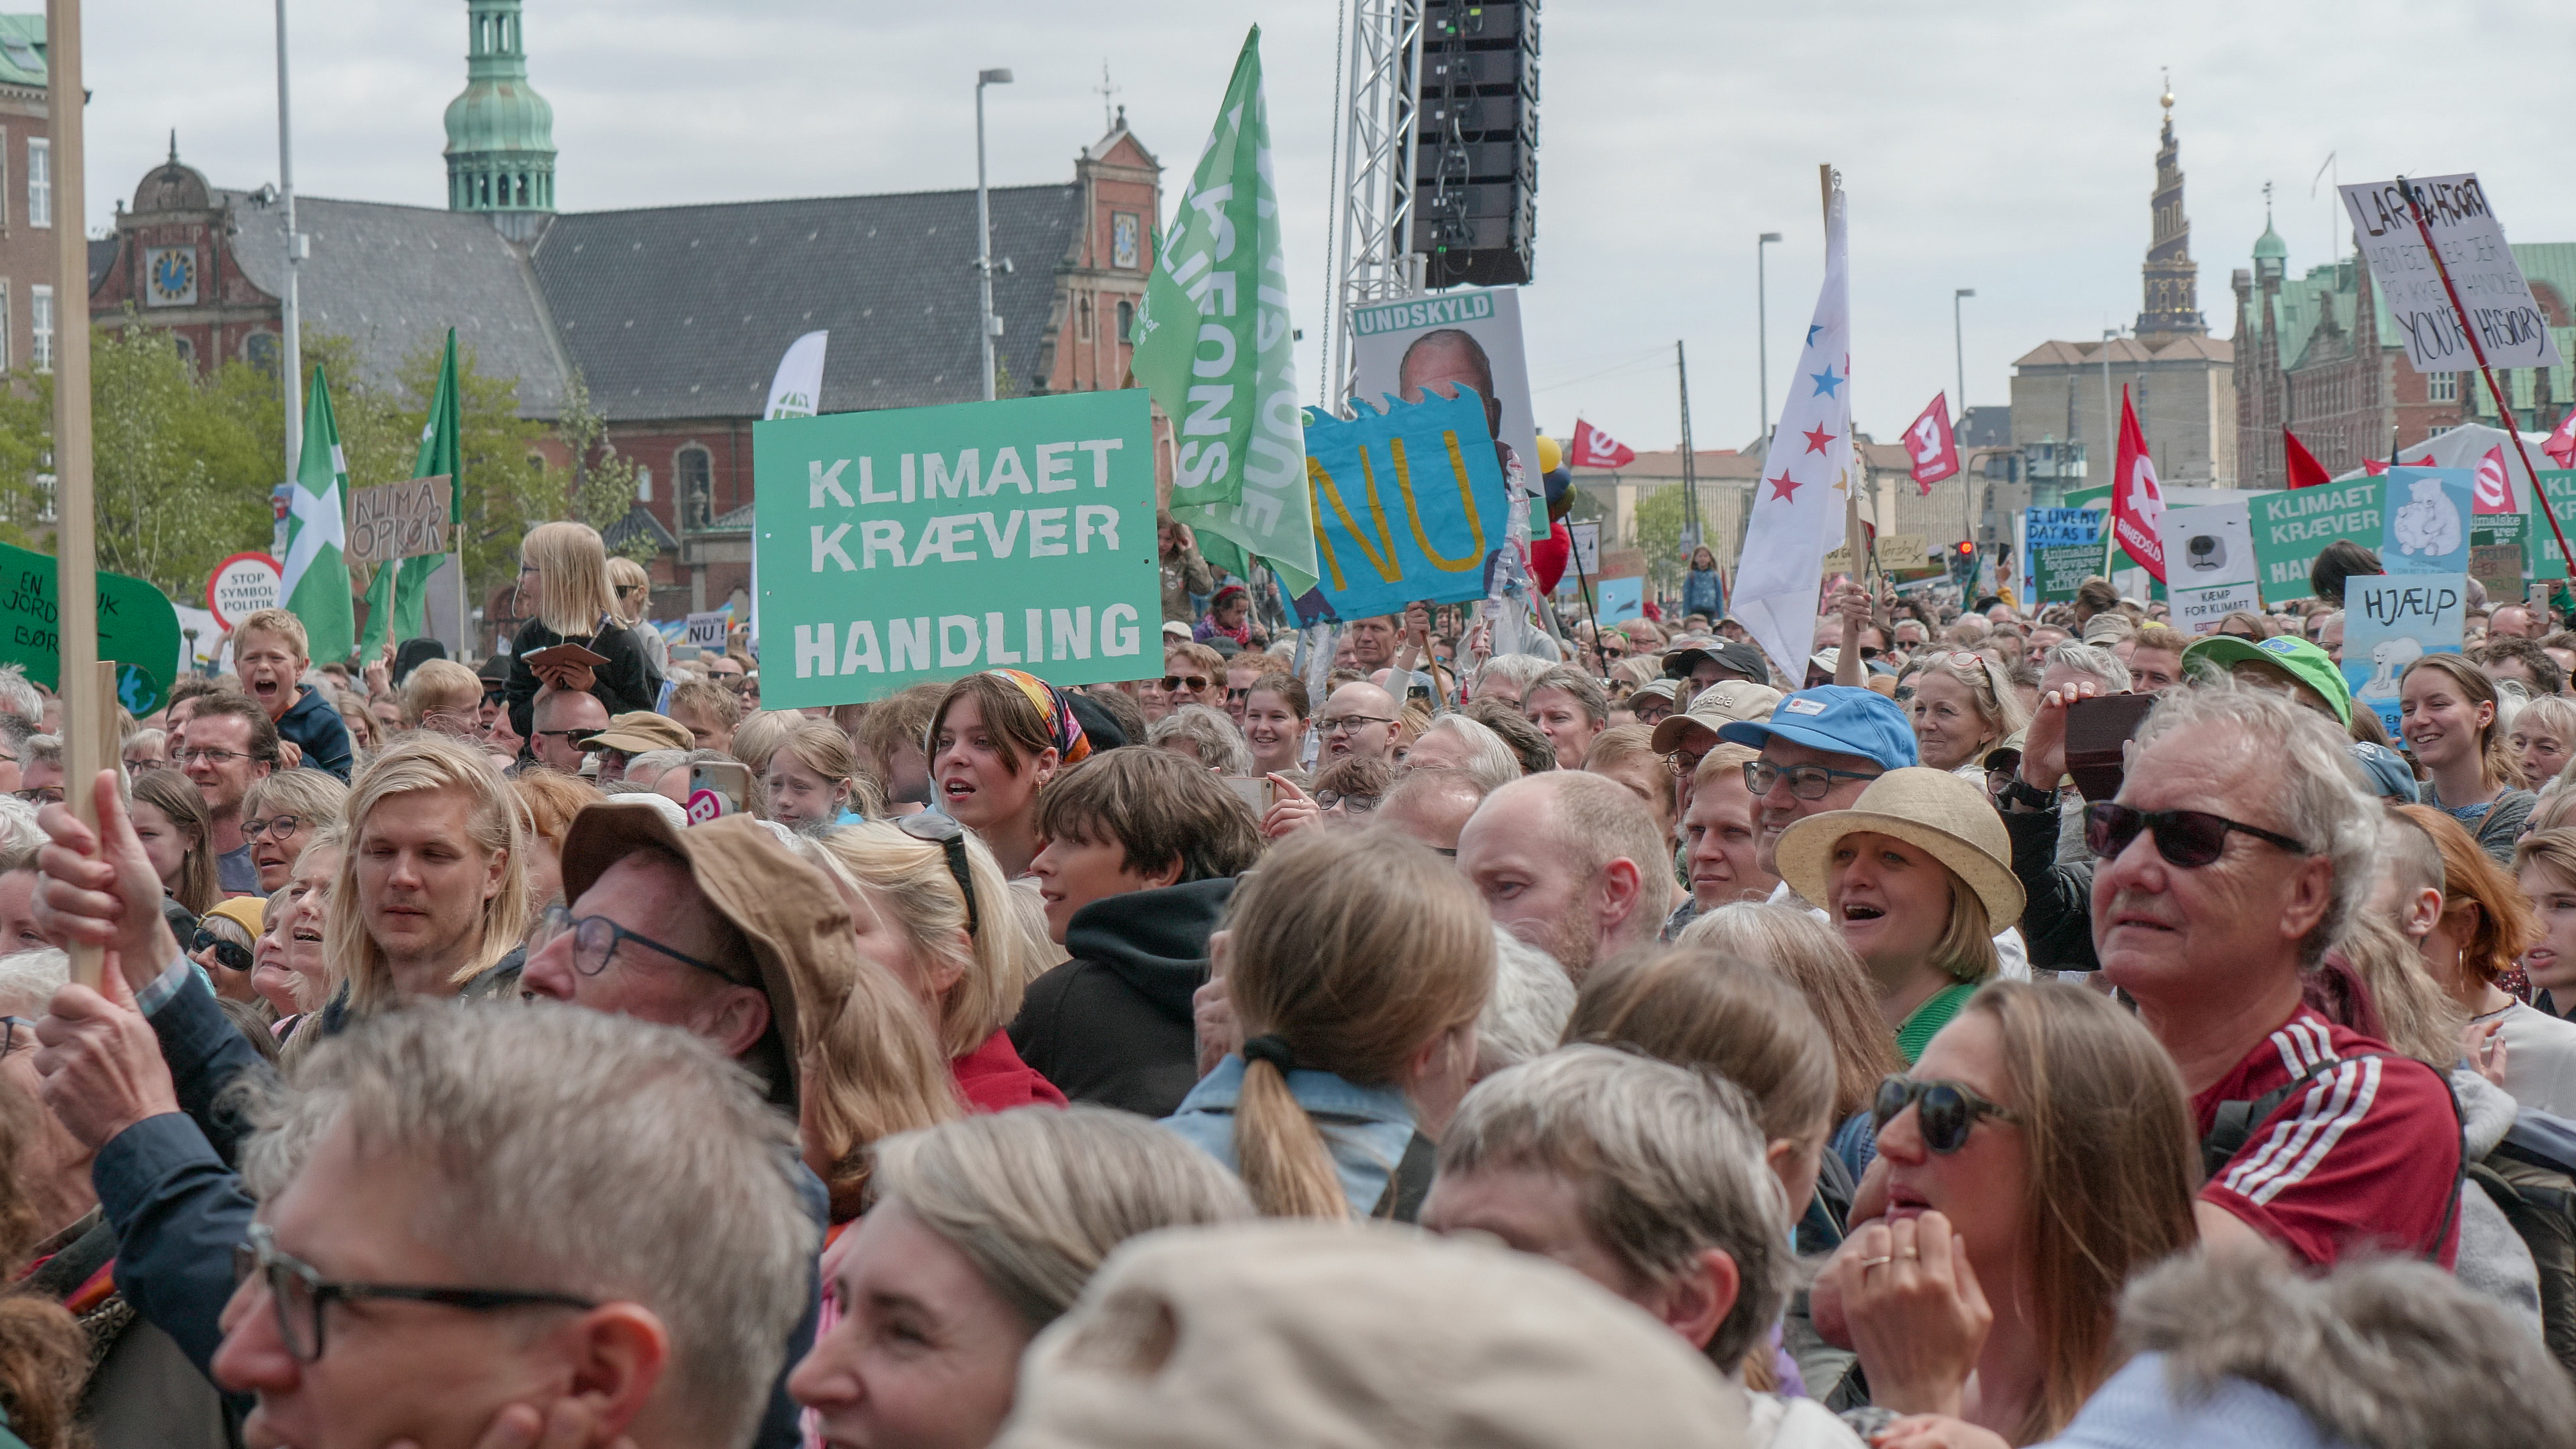
Climate change creates more extreme weather experiences
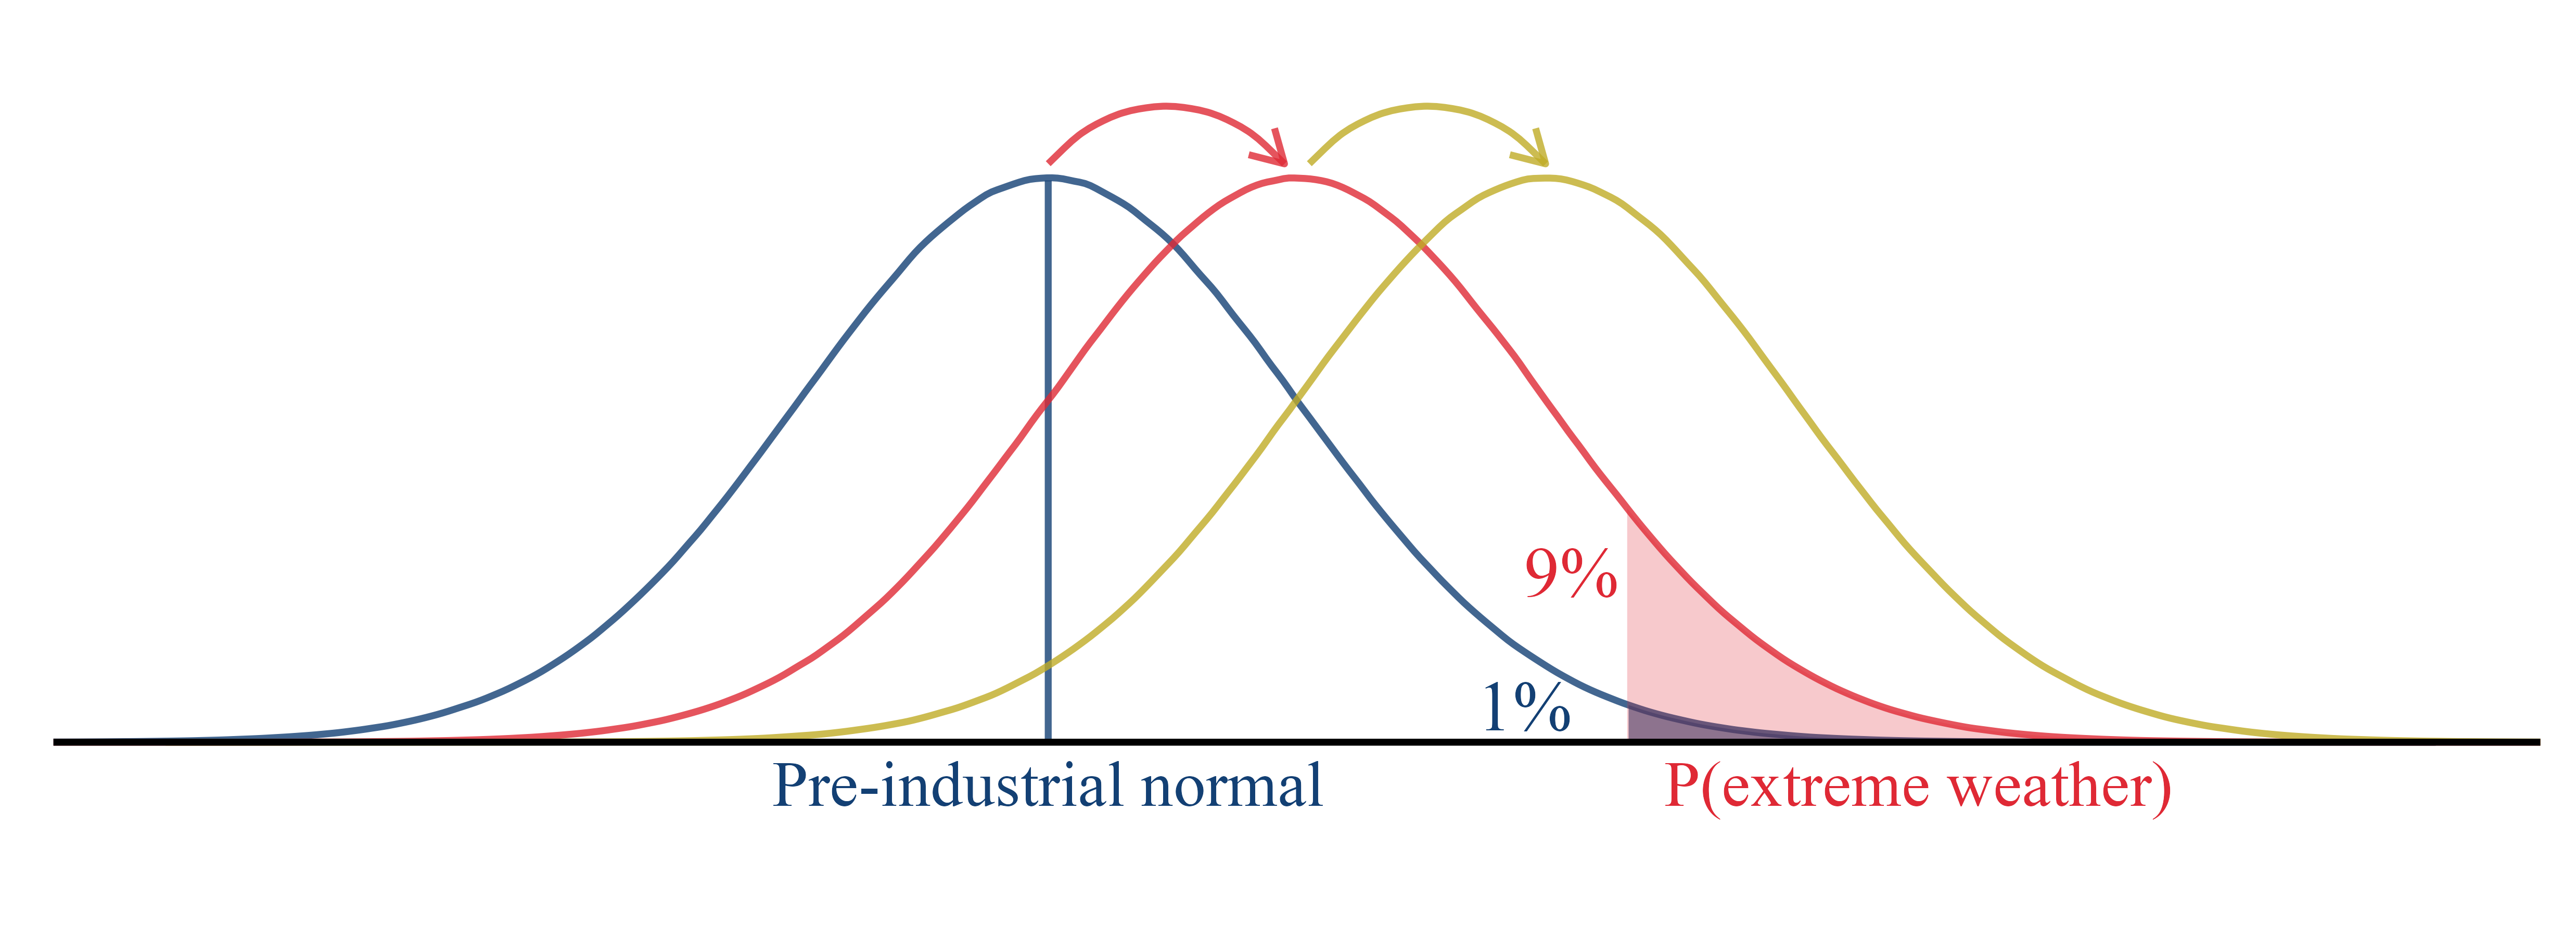
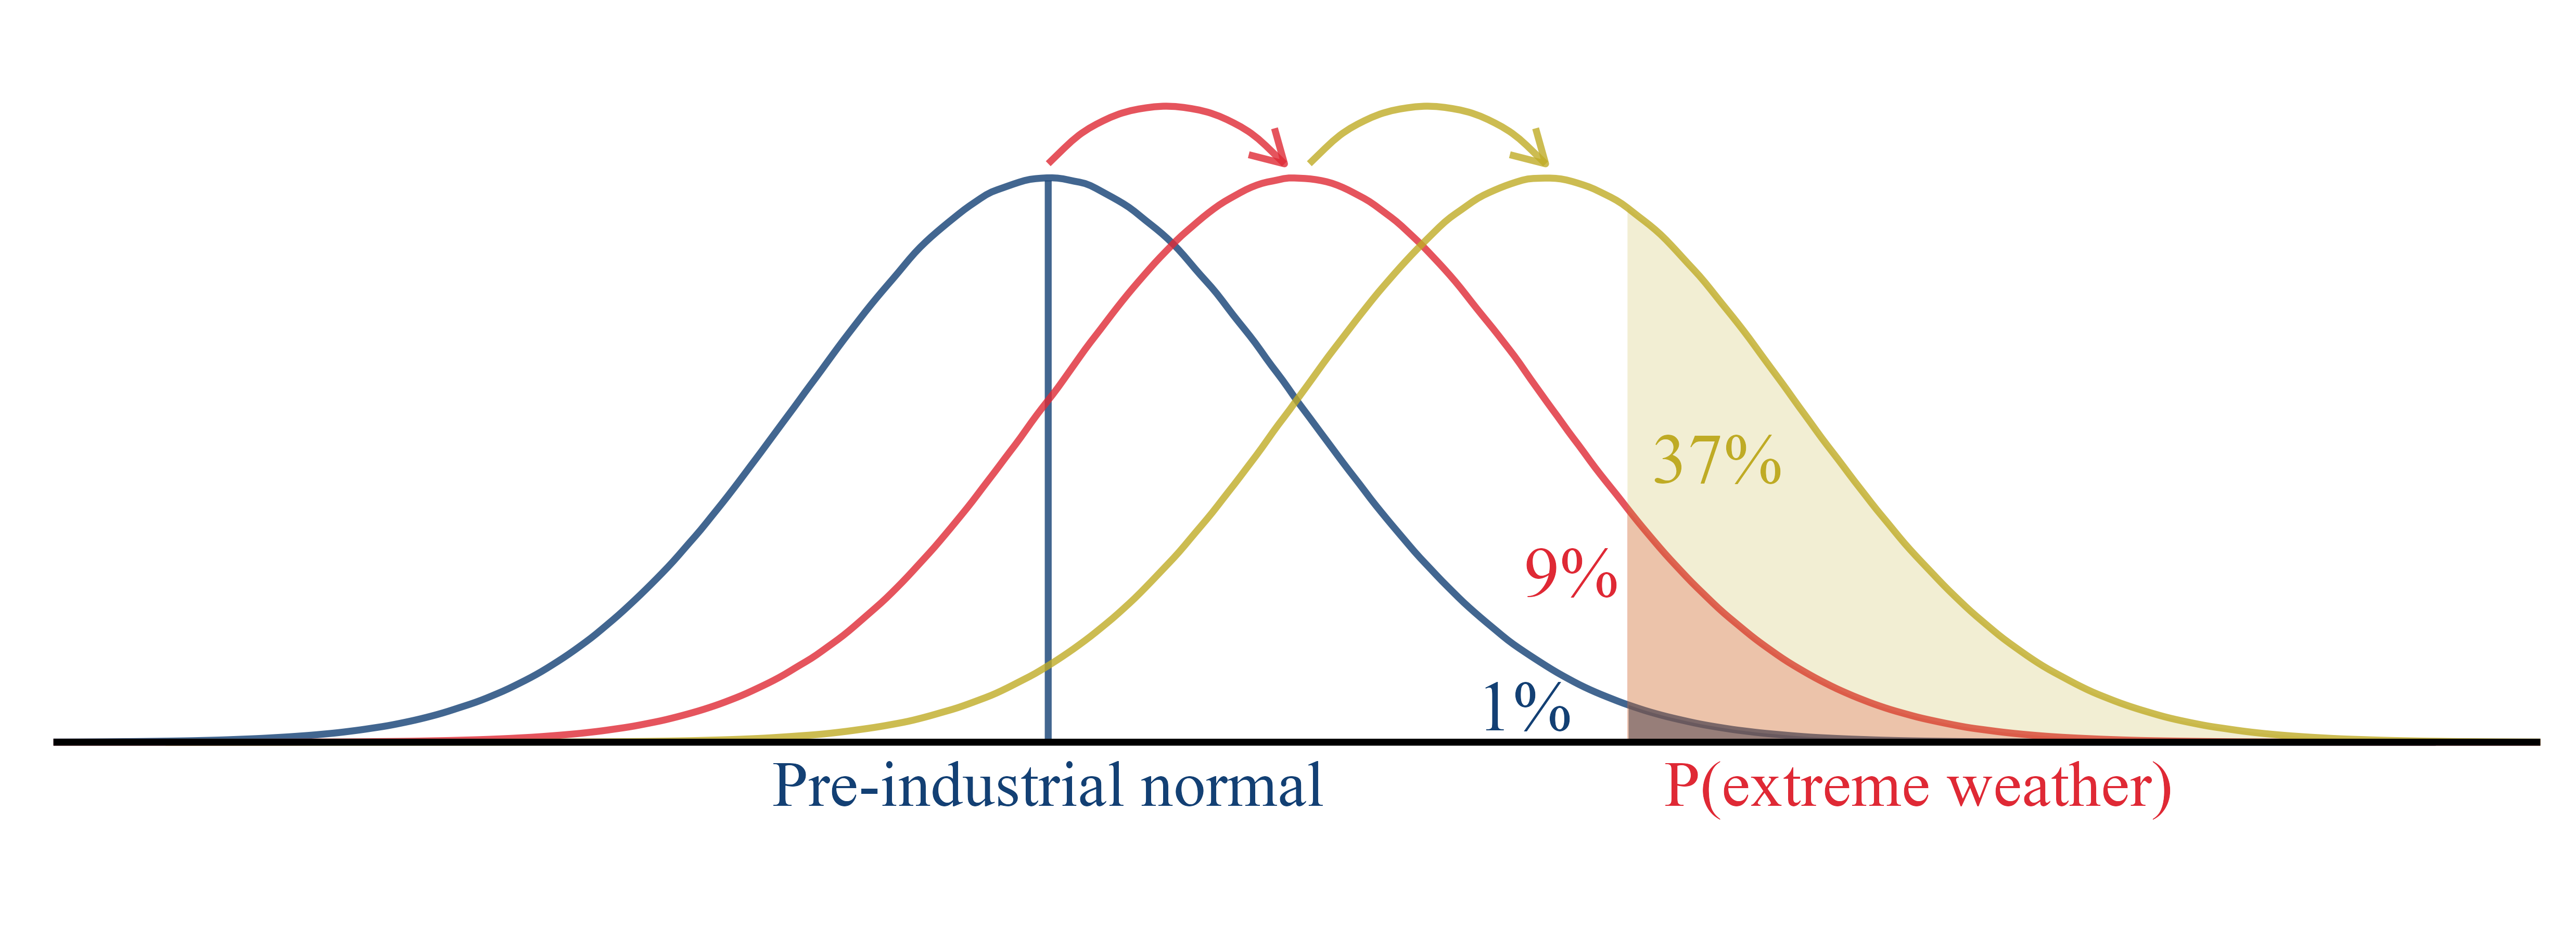
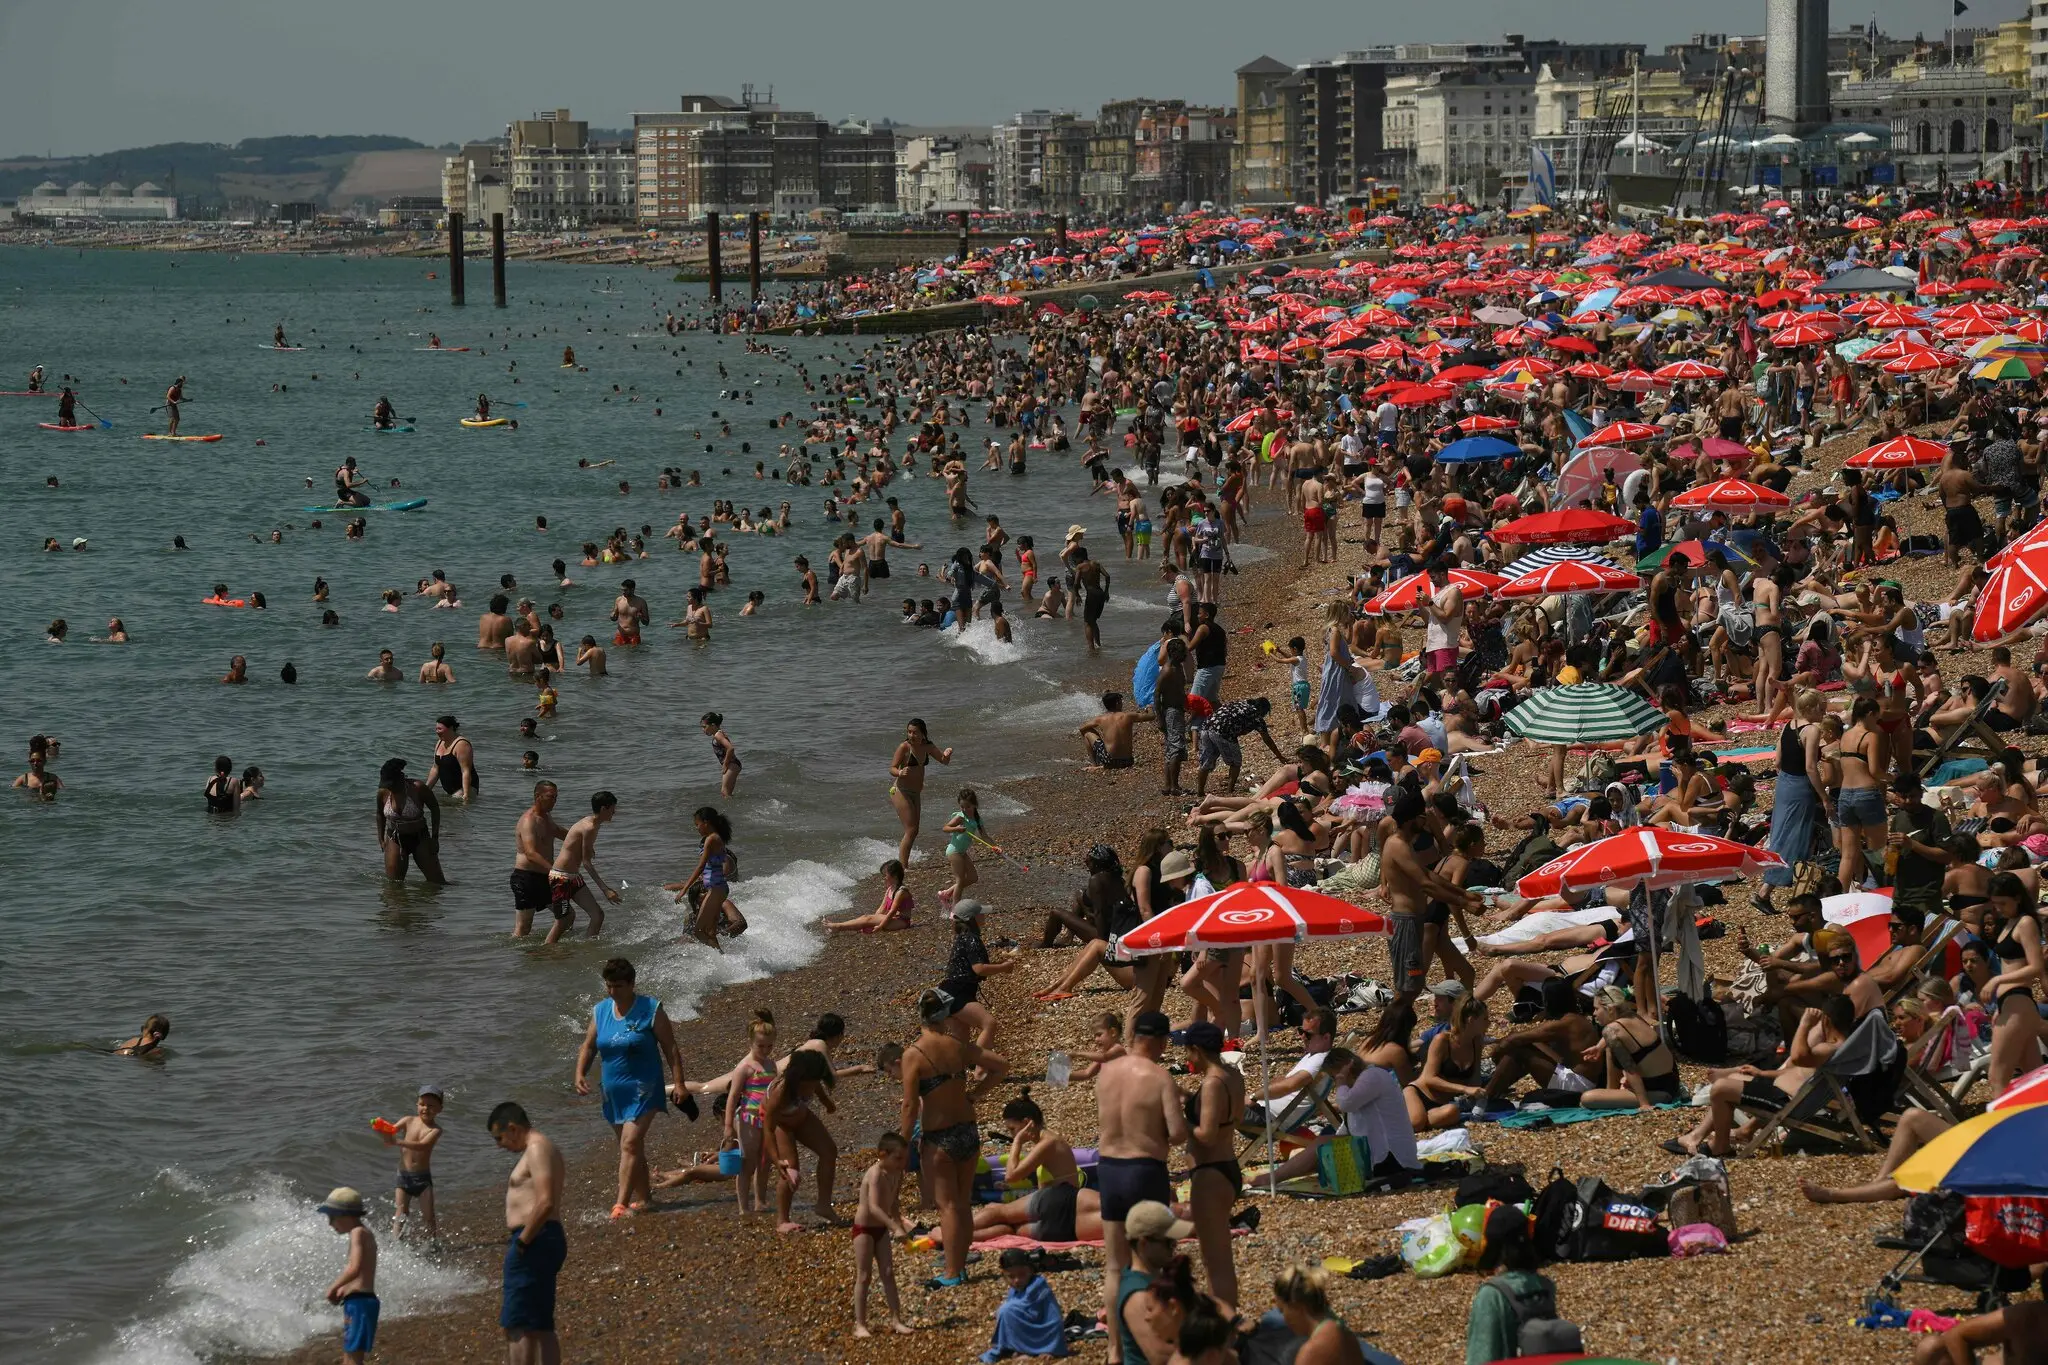
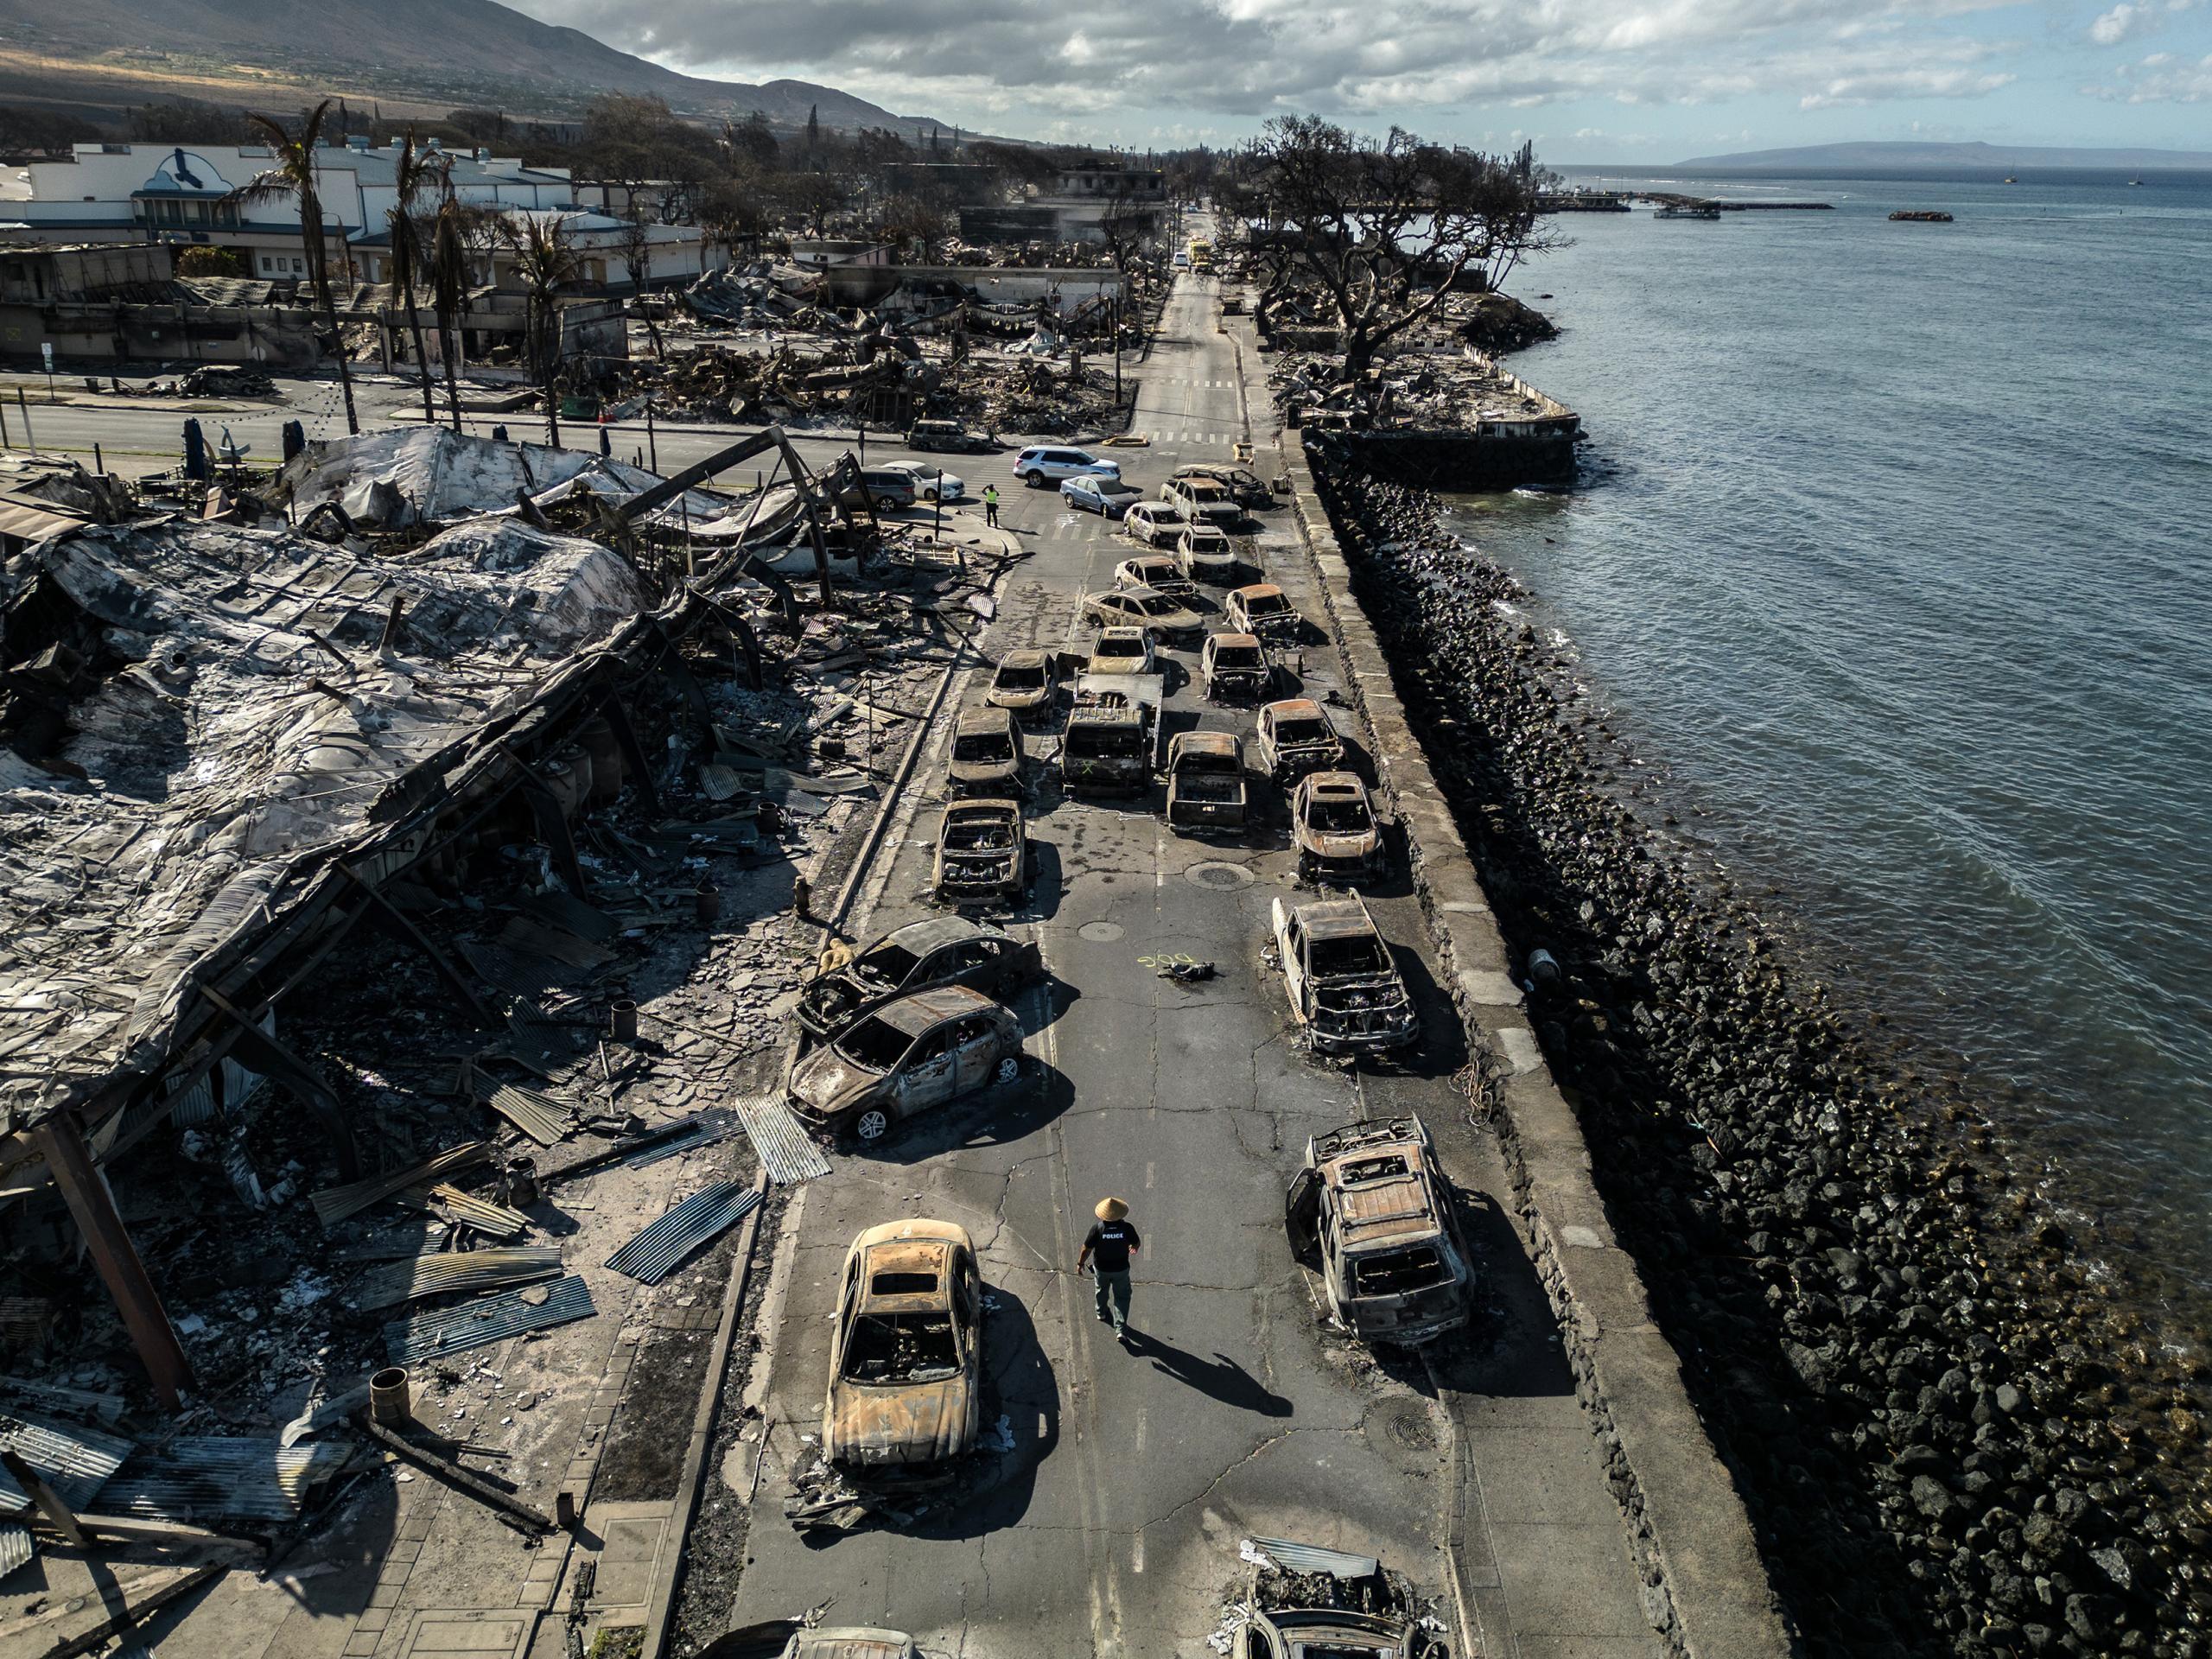
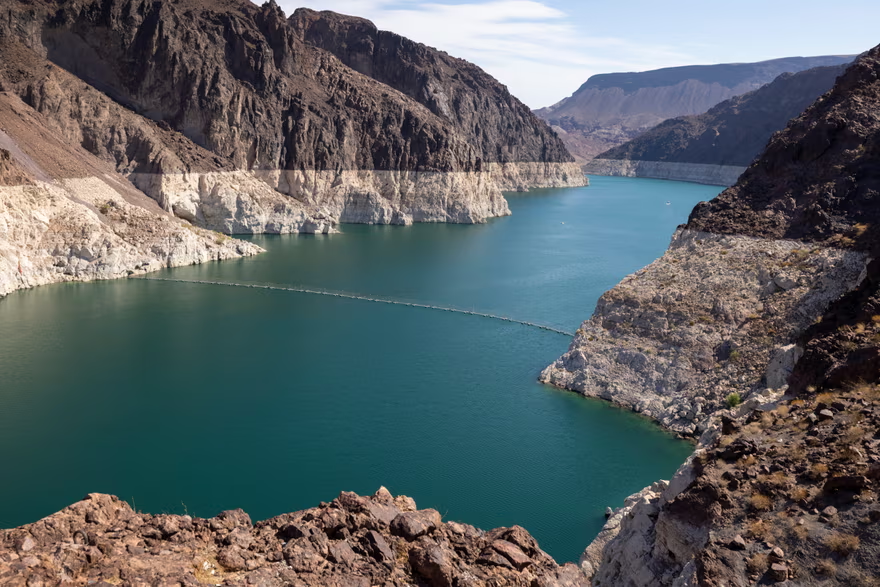
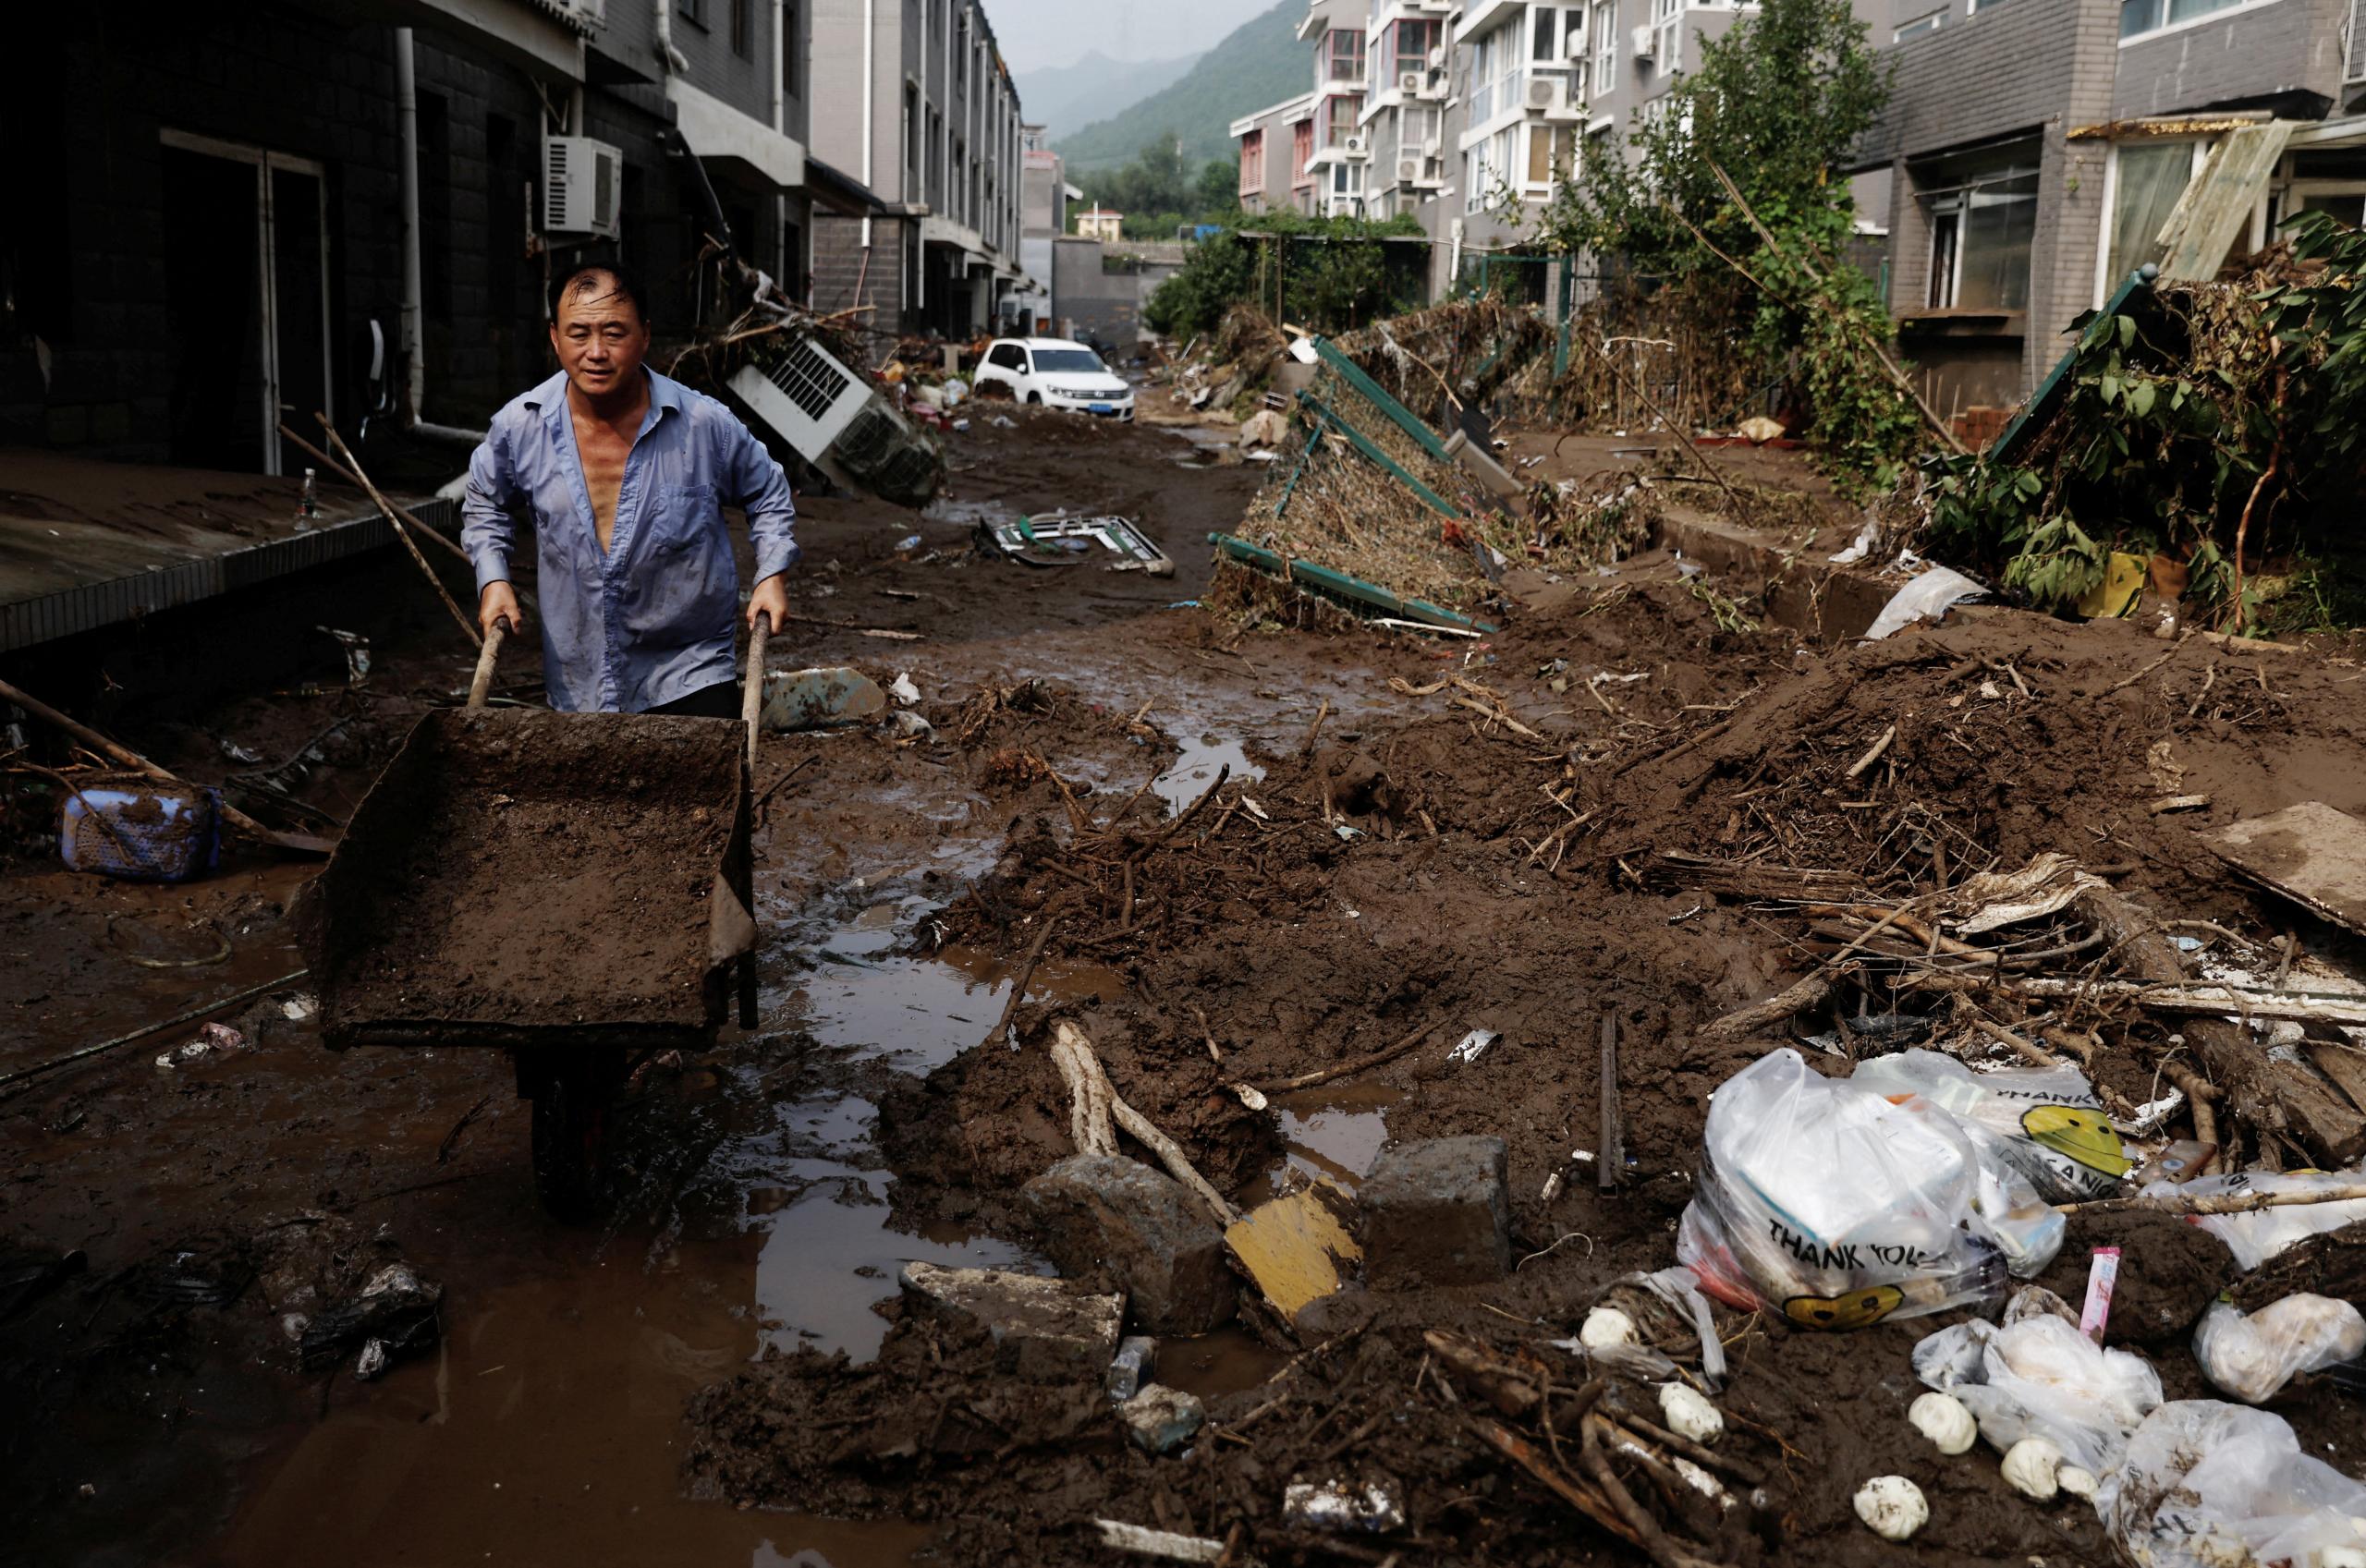
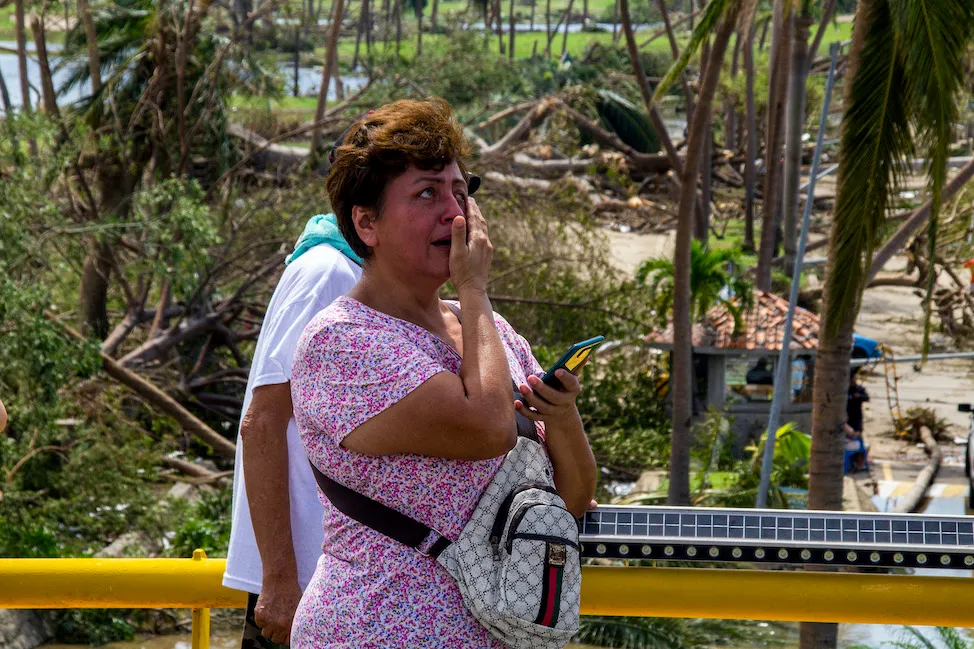
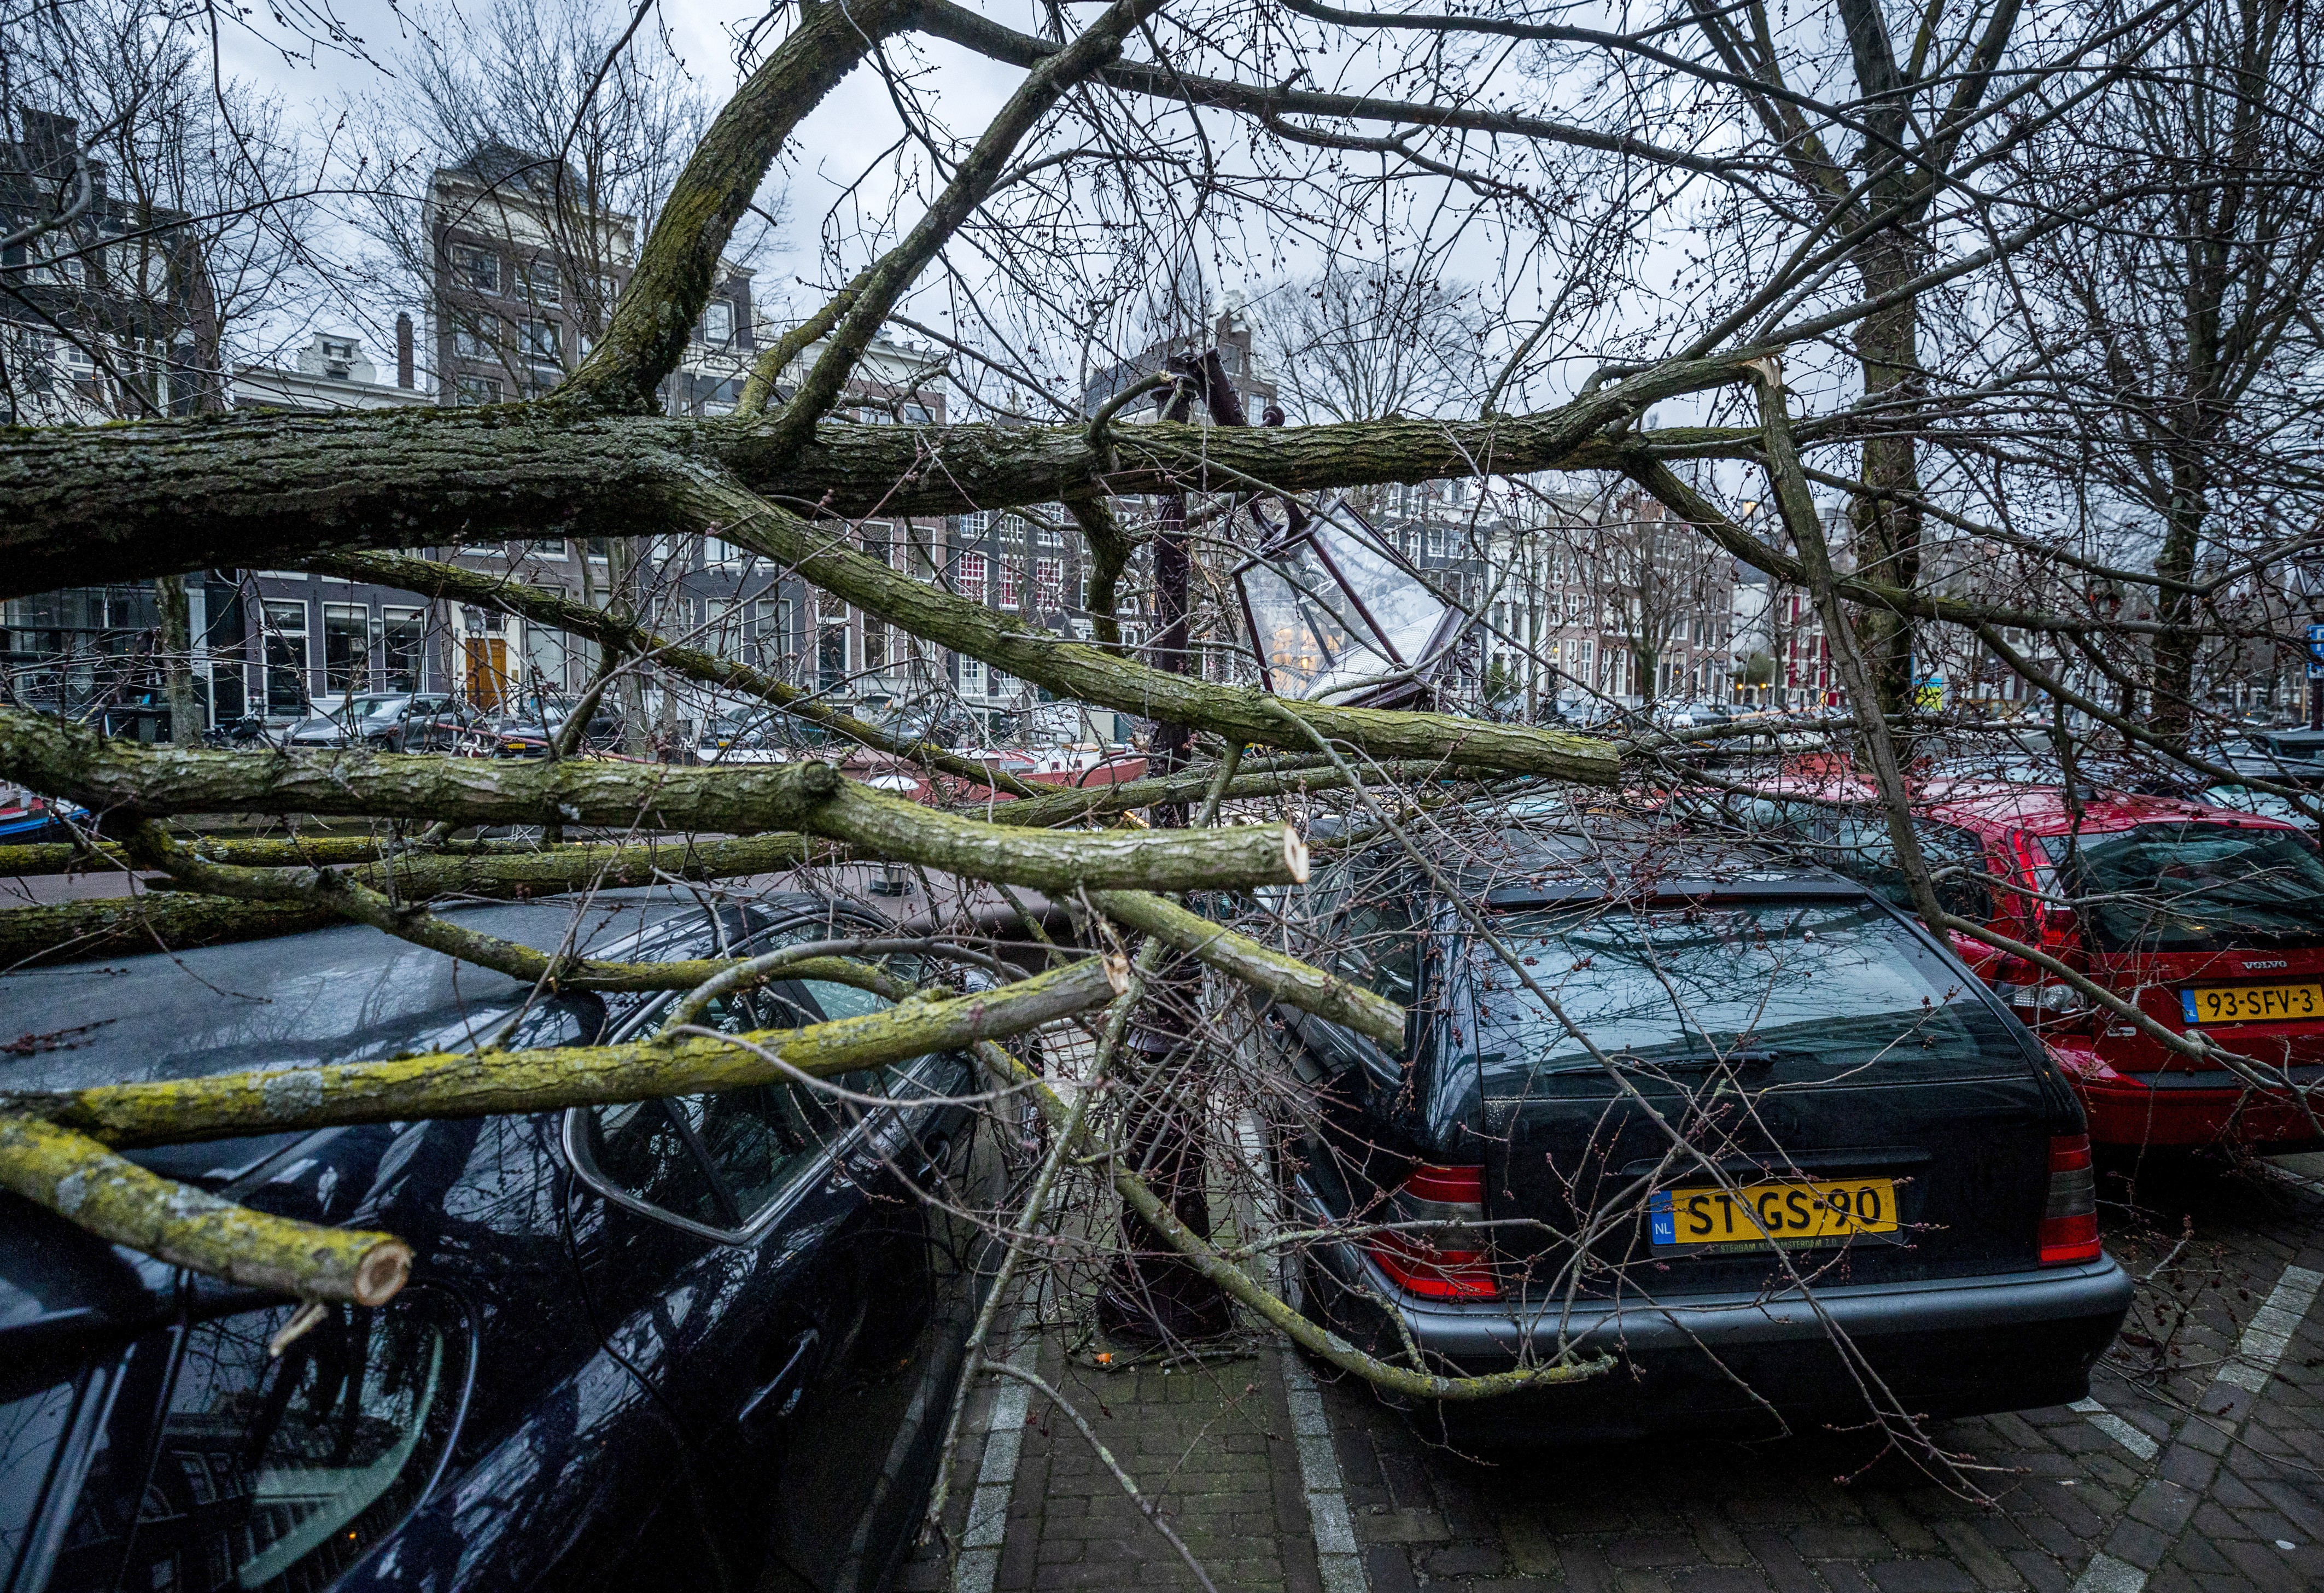
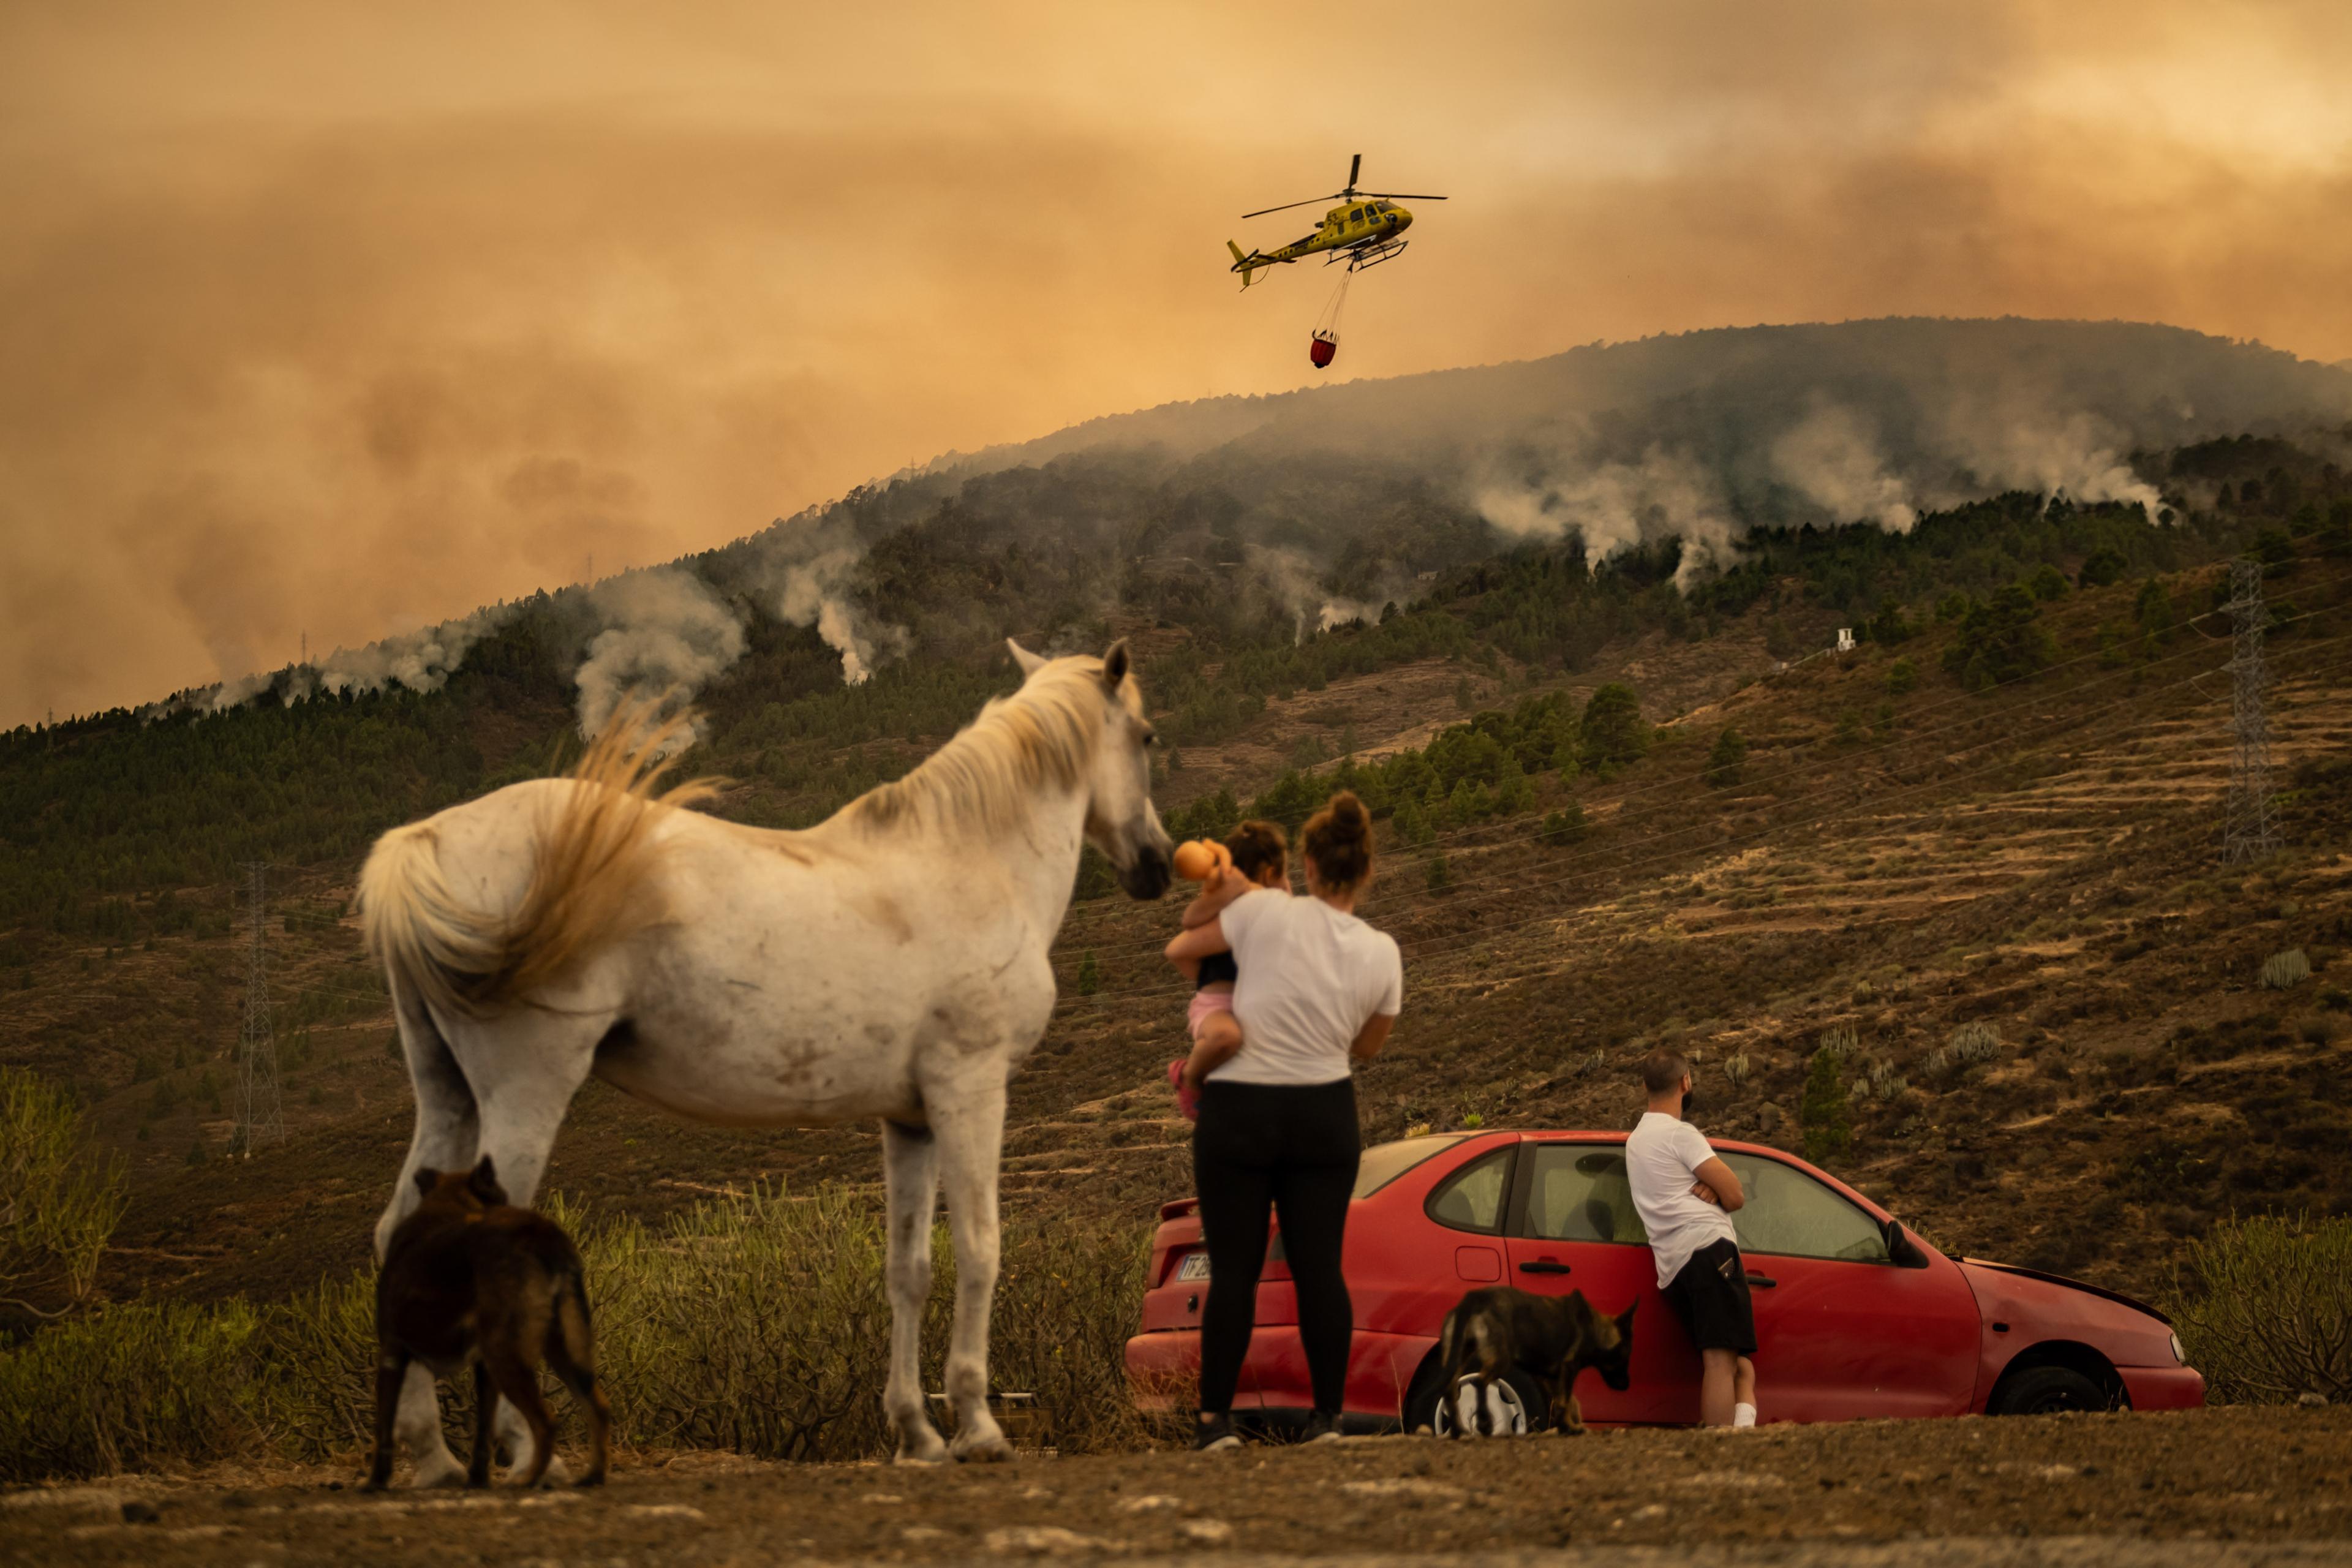
Anadolu Agency/Ritzau Scanpix, Adrian Dennis/AFP/Getty Images, Jacob Ehrbahn, Tingshu Wang, Oscar Guerrero Ramirez/Getty Images, Remko de Waal/ANP/AFP, Daniel Leal/Agence France-Presse/Getty Images, Go Nakamura/The New York Times, David McNew/Getty Images

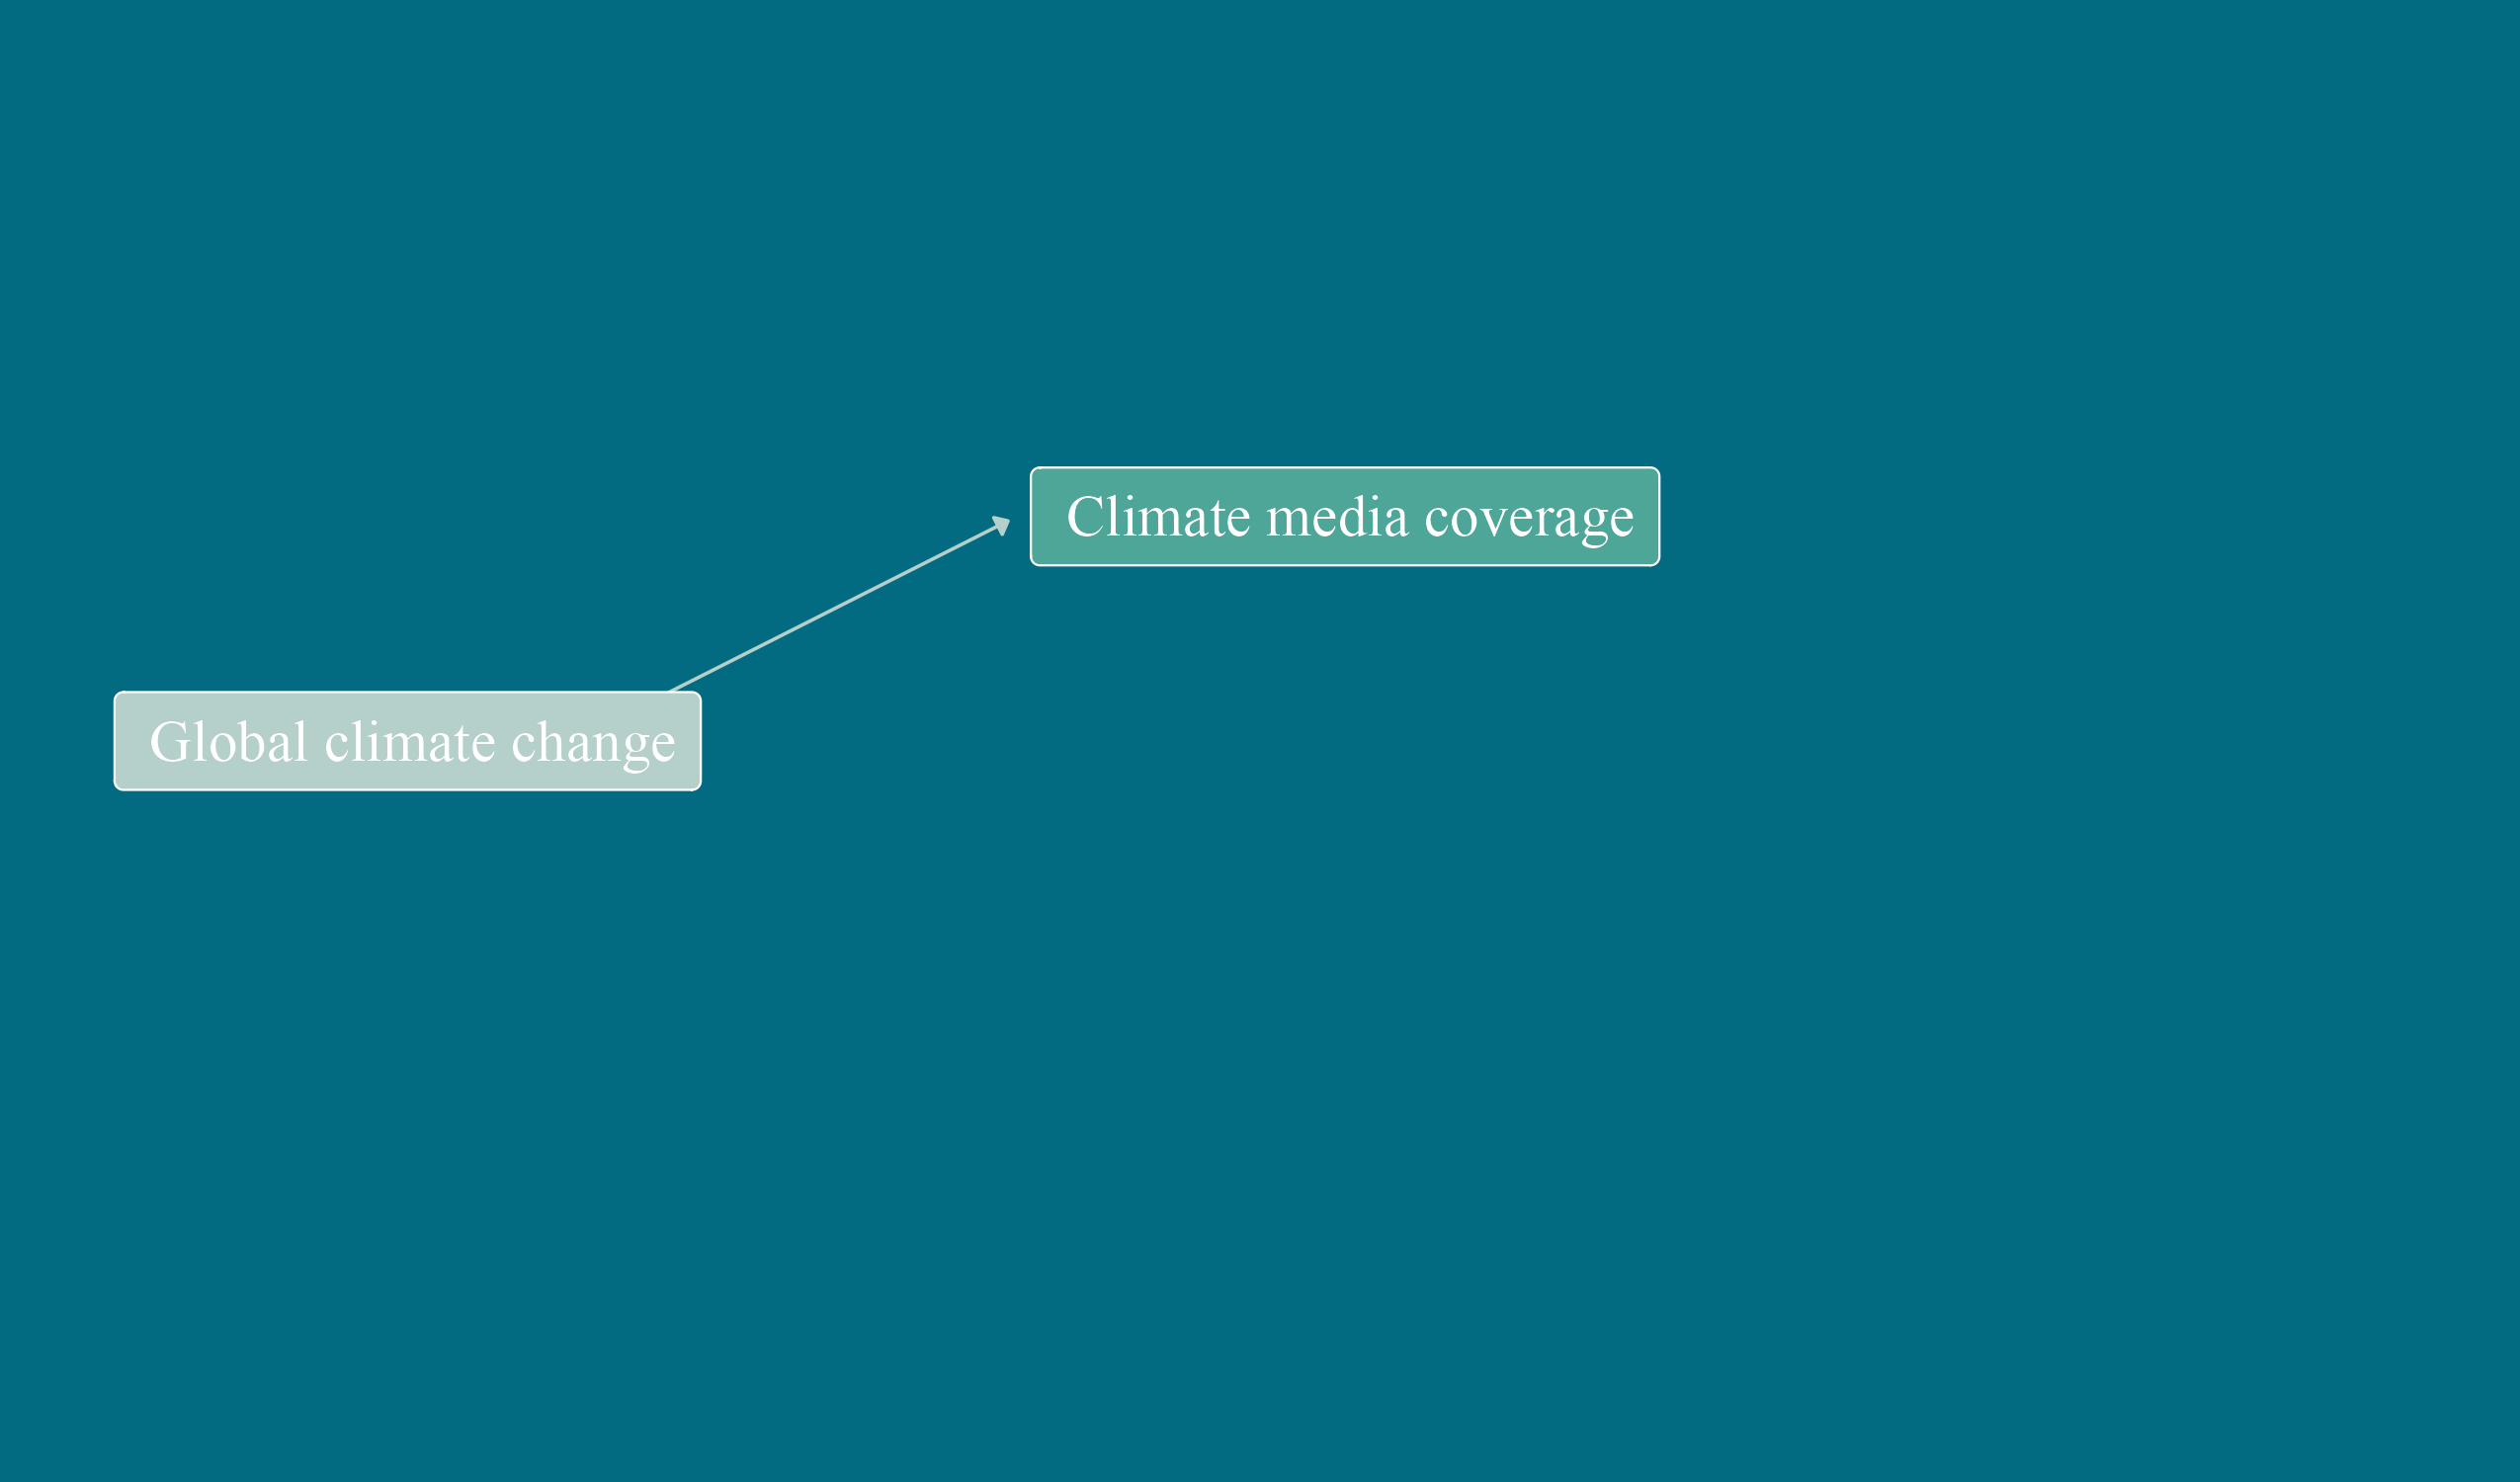

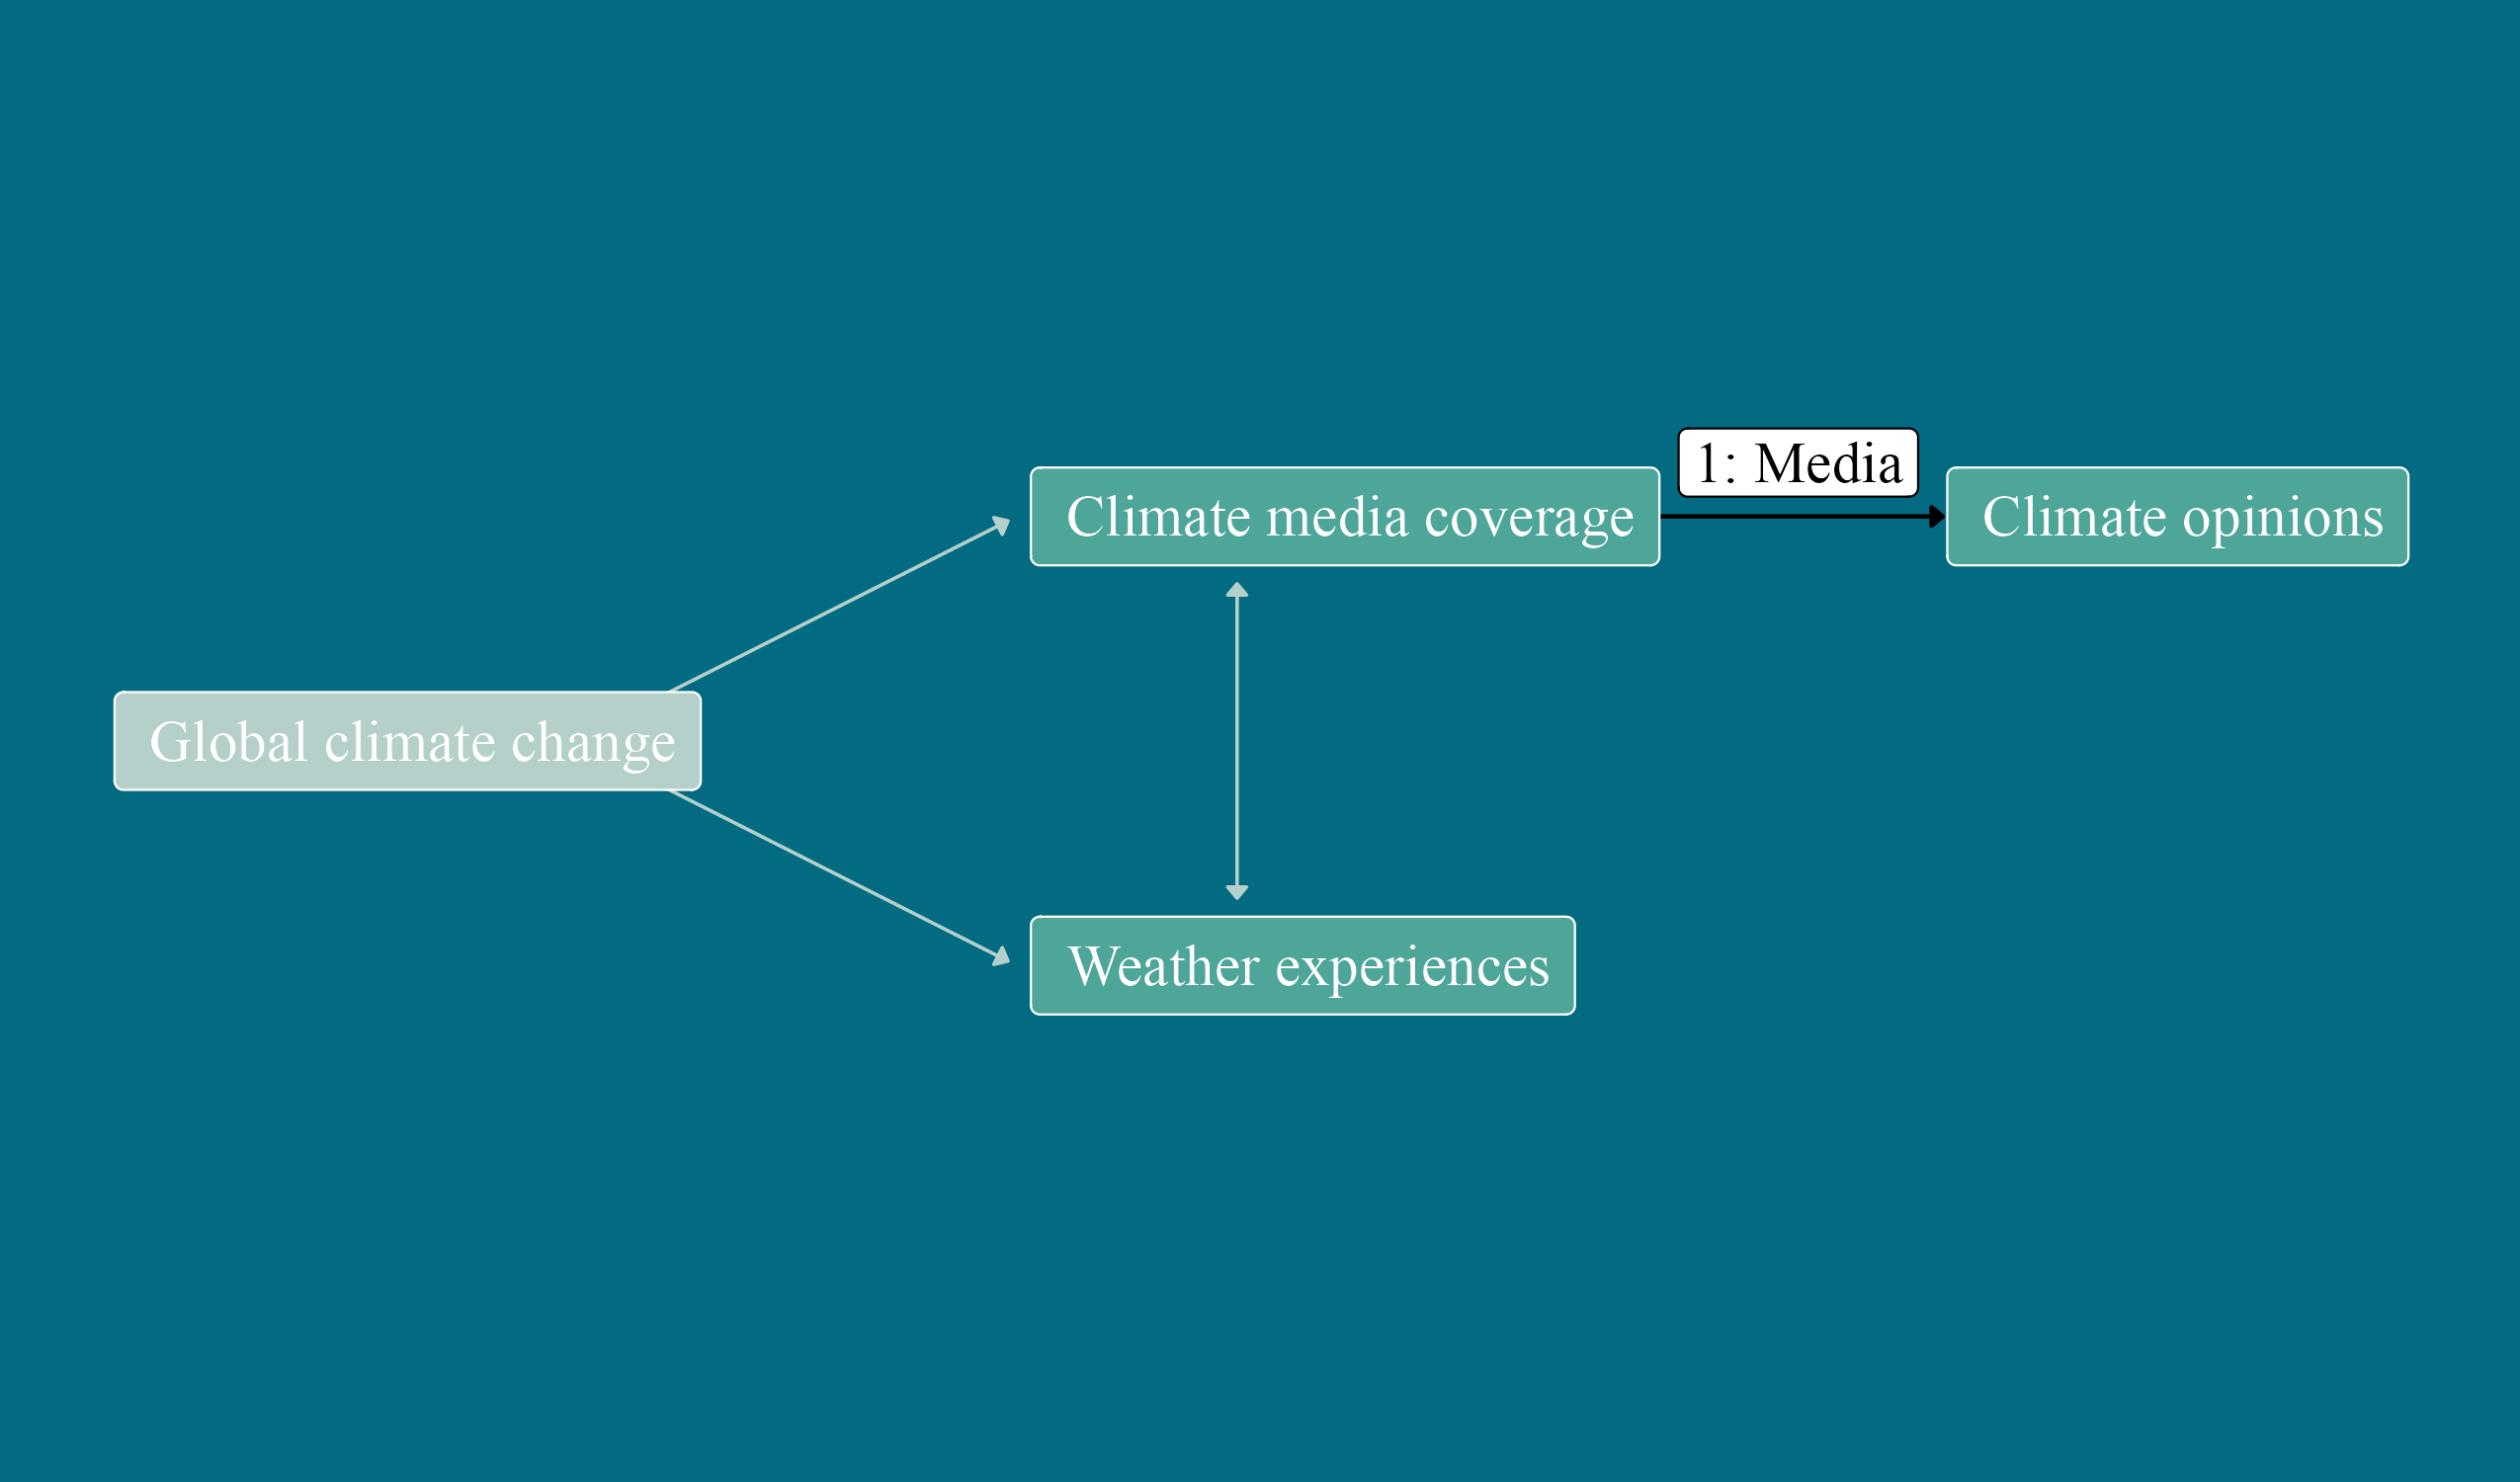
Article 1: Media
- “Mass media influence on the rapid rise of climate change”
- Published in International Journal of Public Opinion Research (2022)
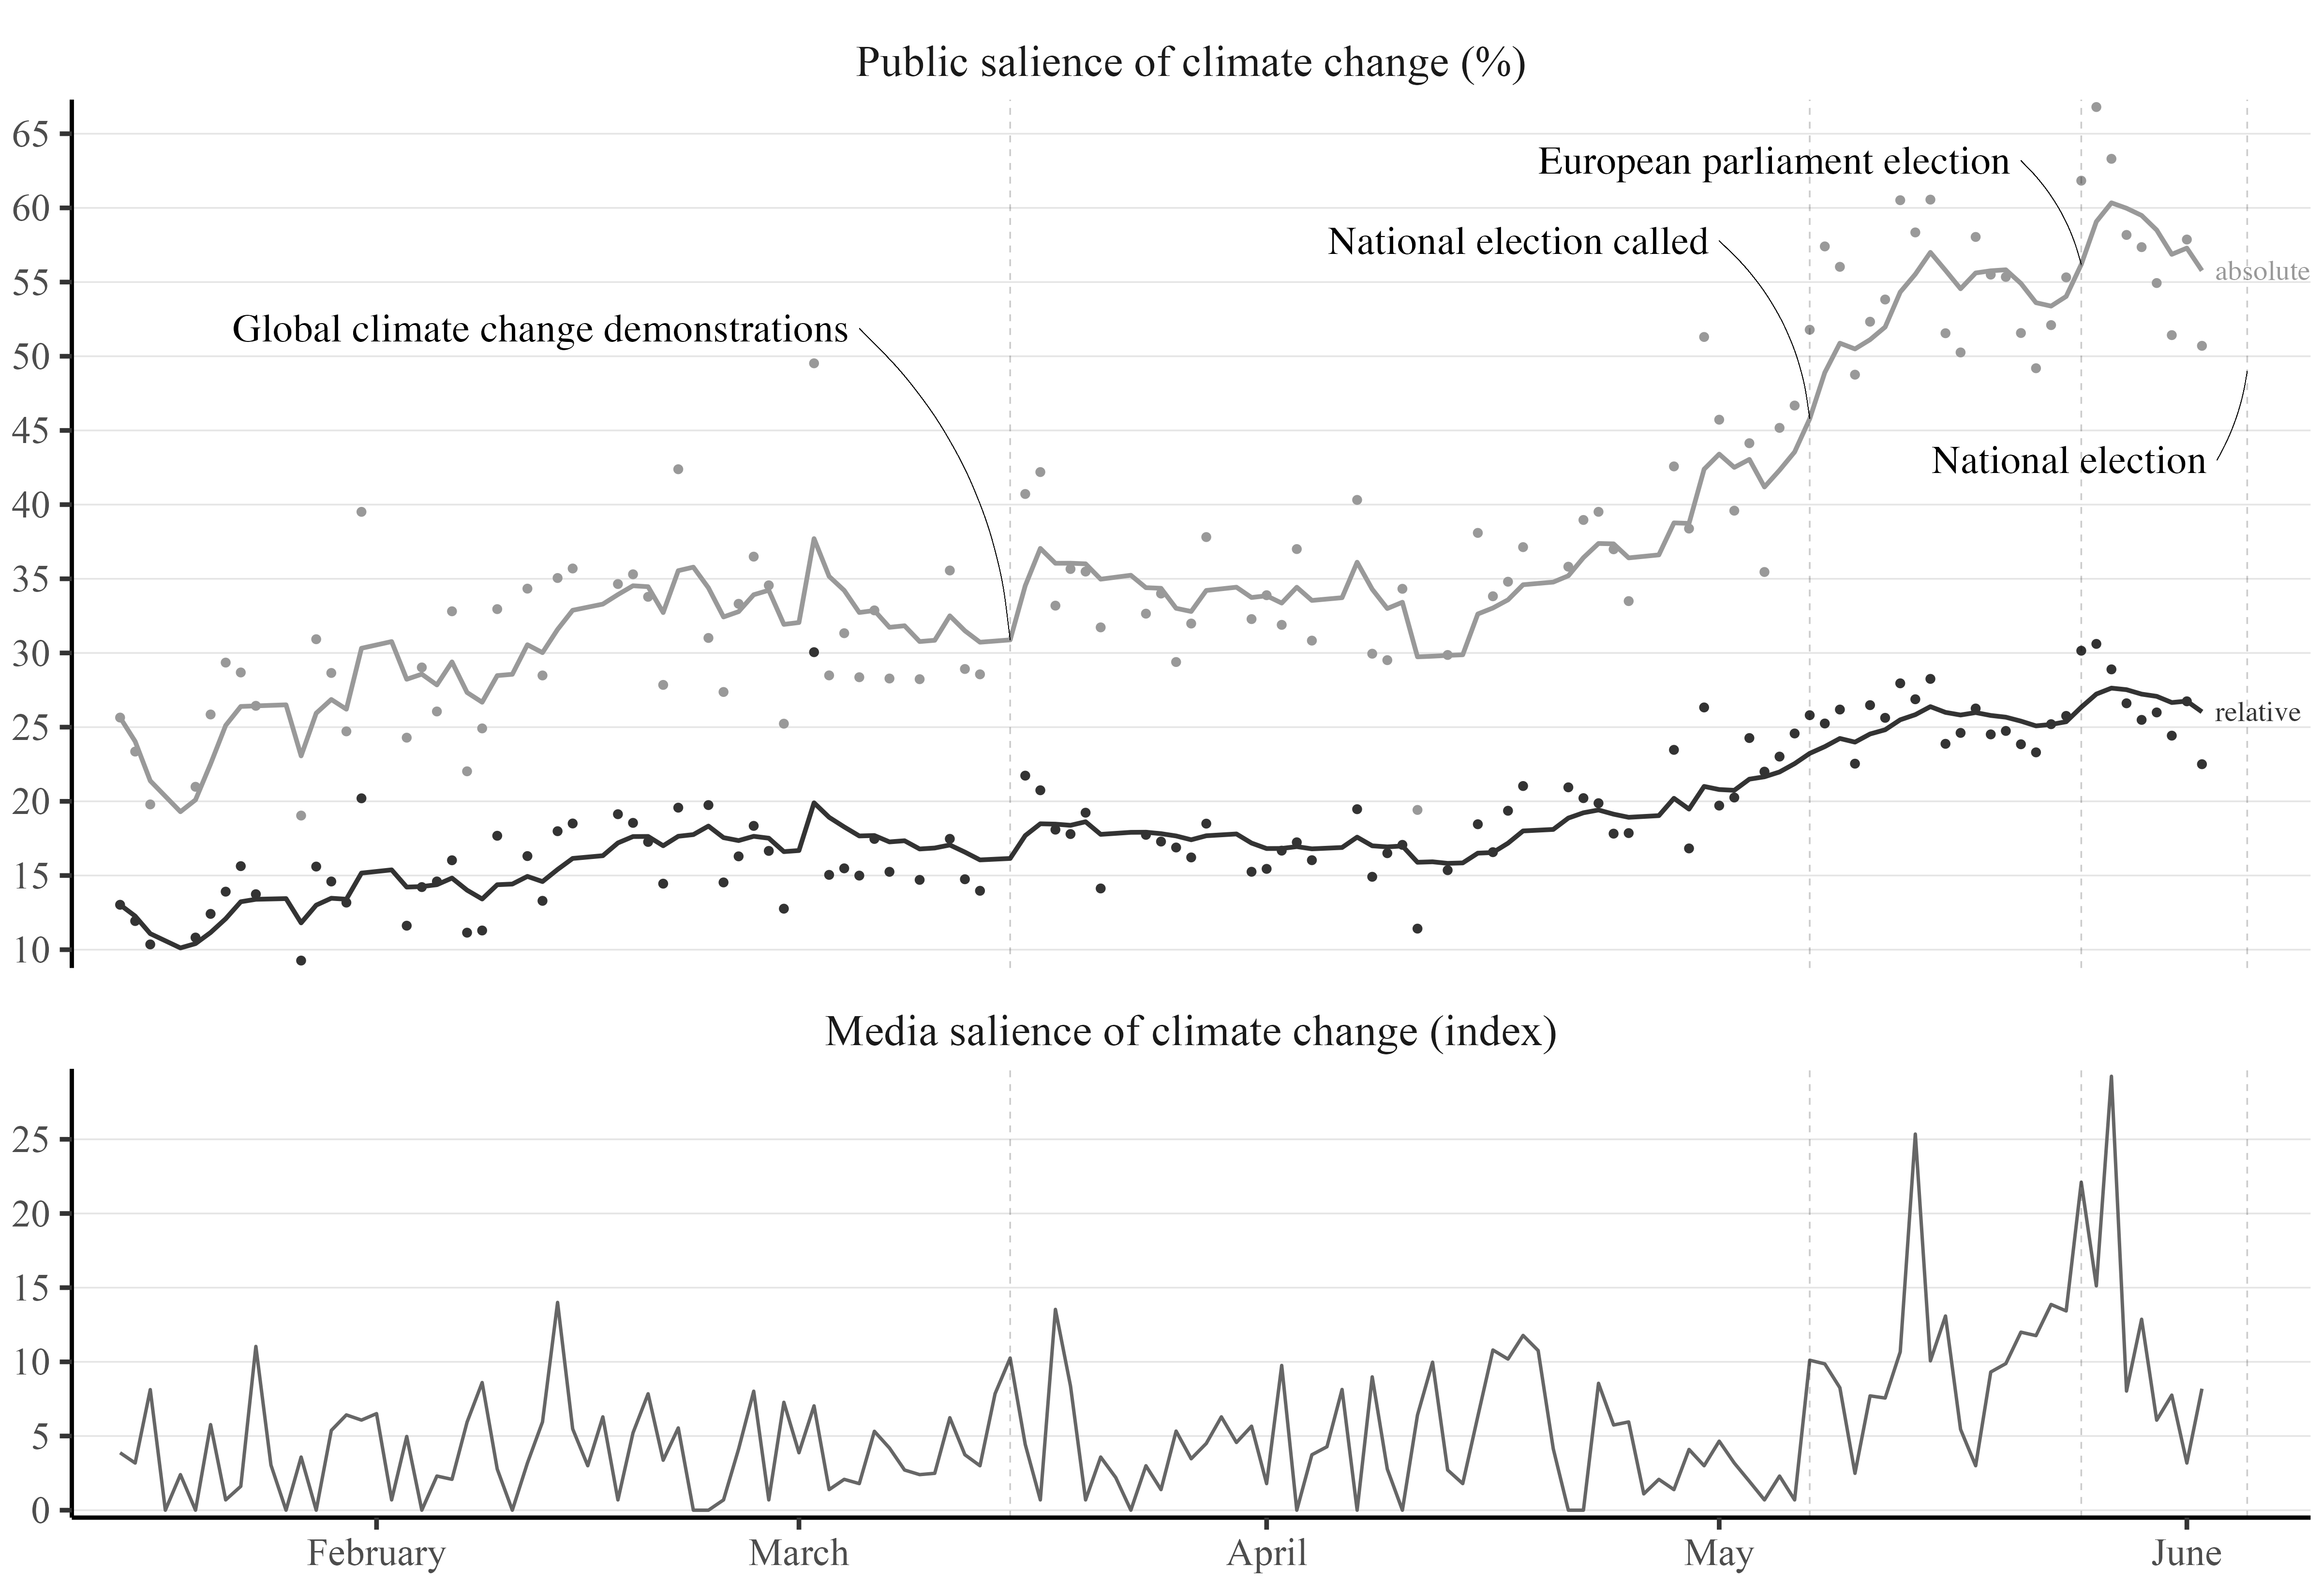
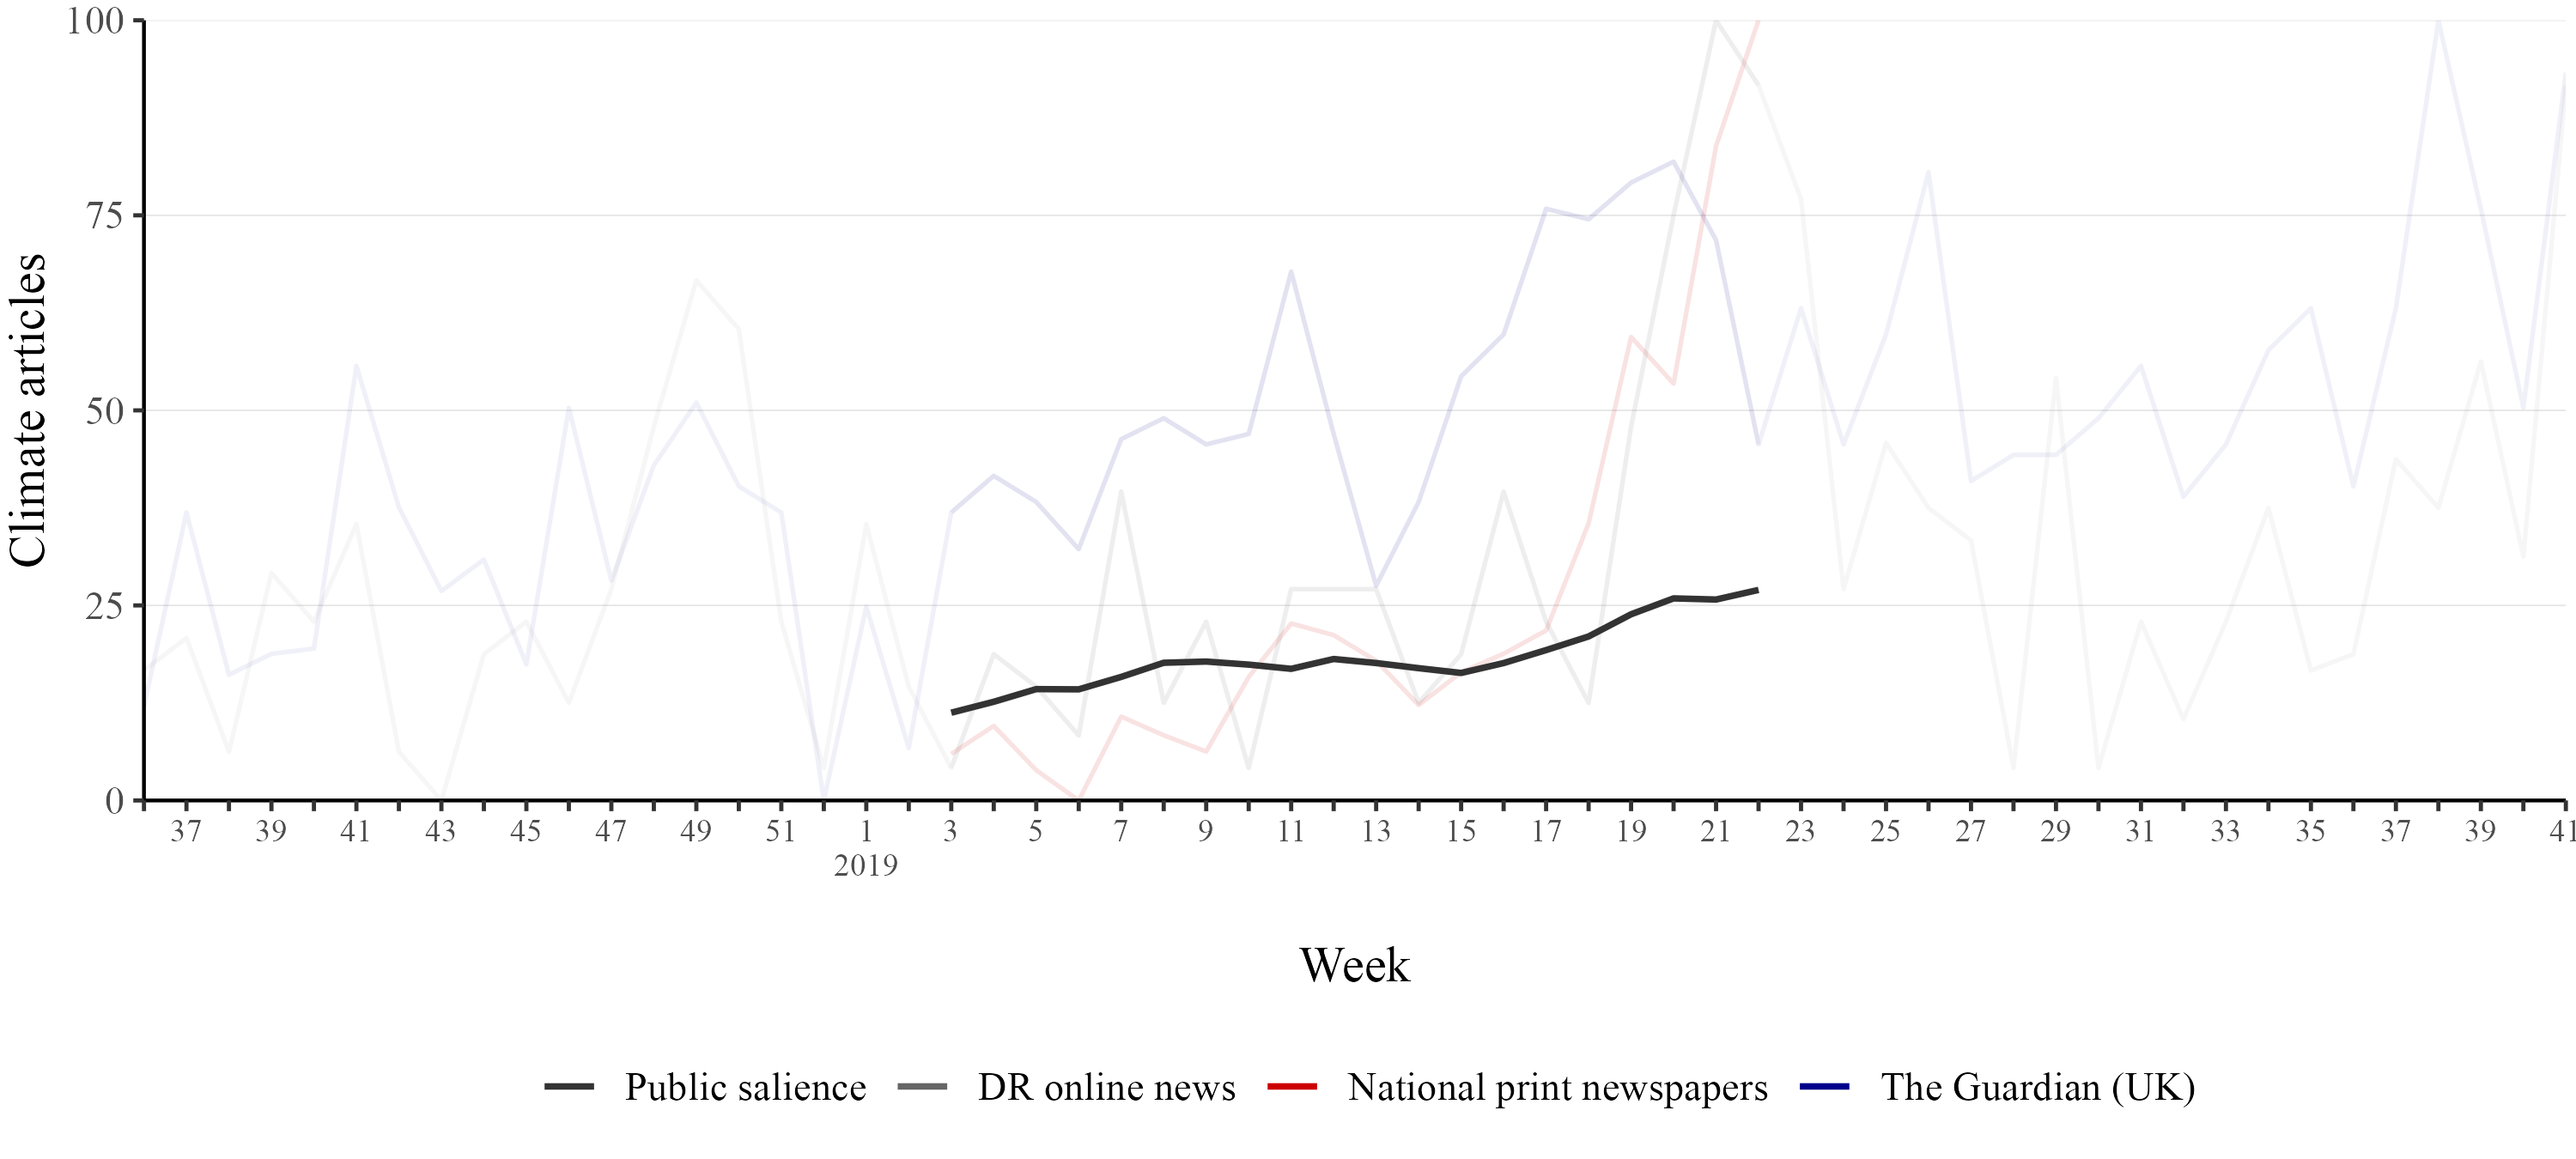
Does mass media coverage of climate change increase public salience?
(prev. slide) Greenpeace Danmark
Climate change’s rapid rise in 2019
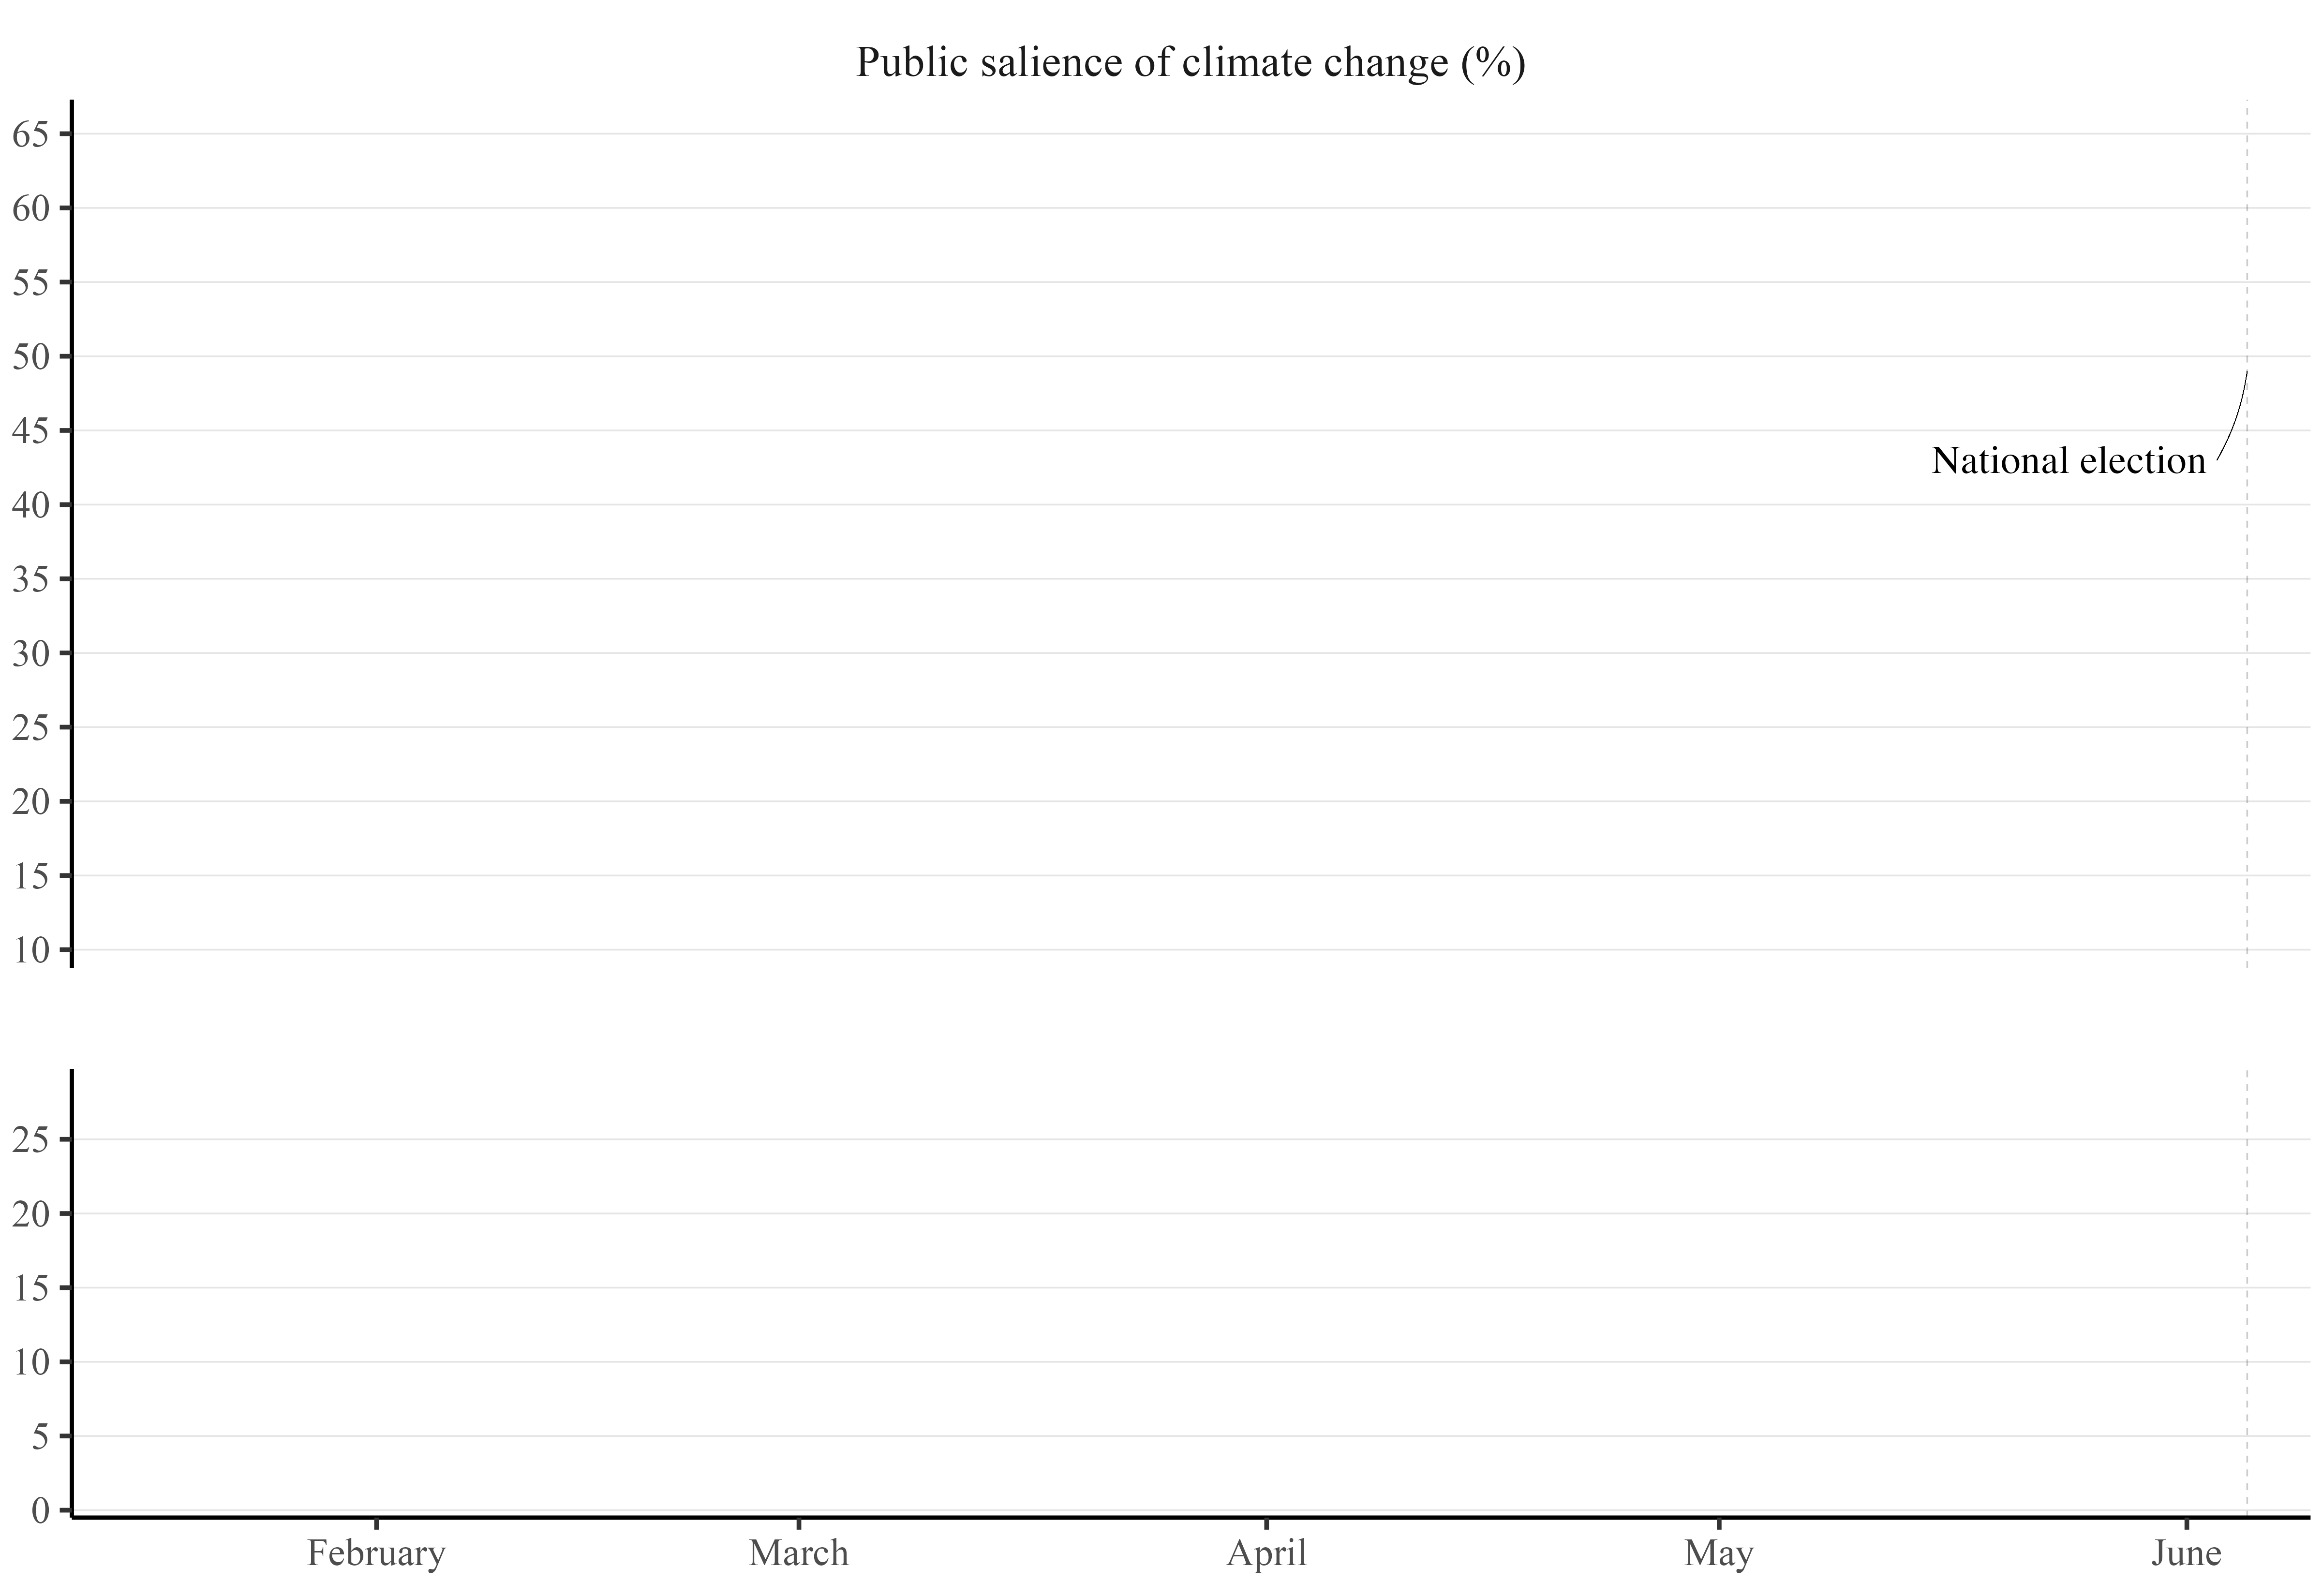
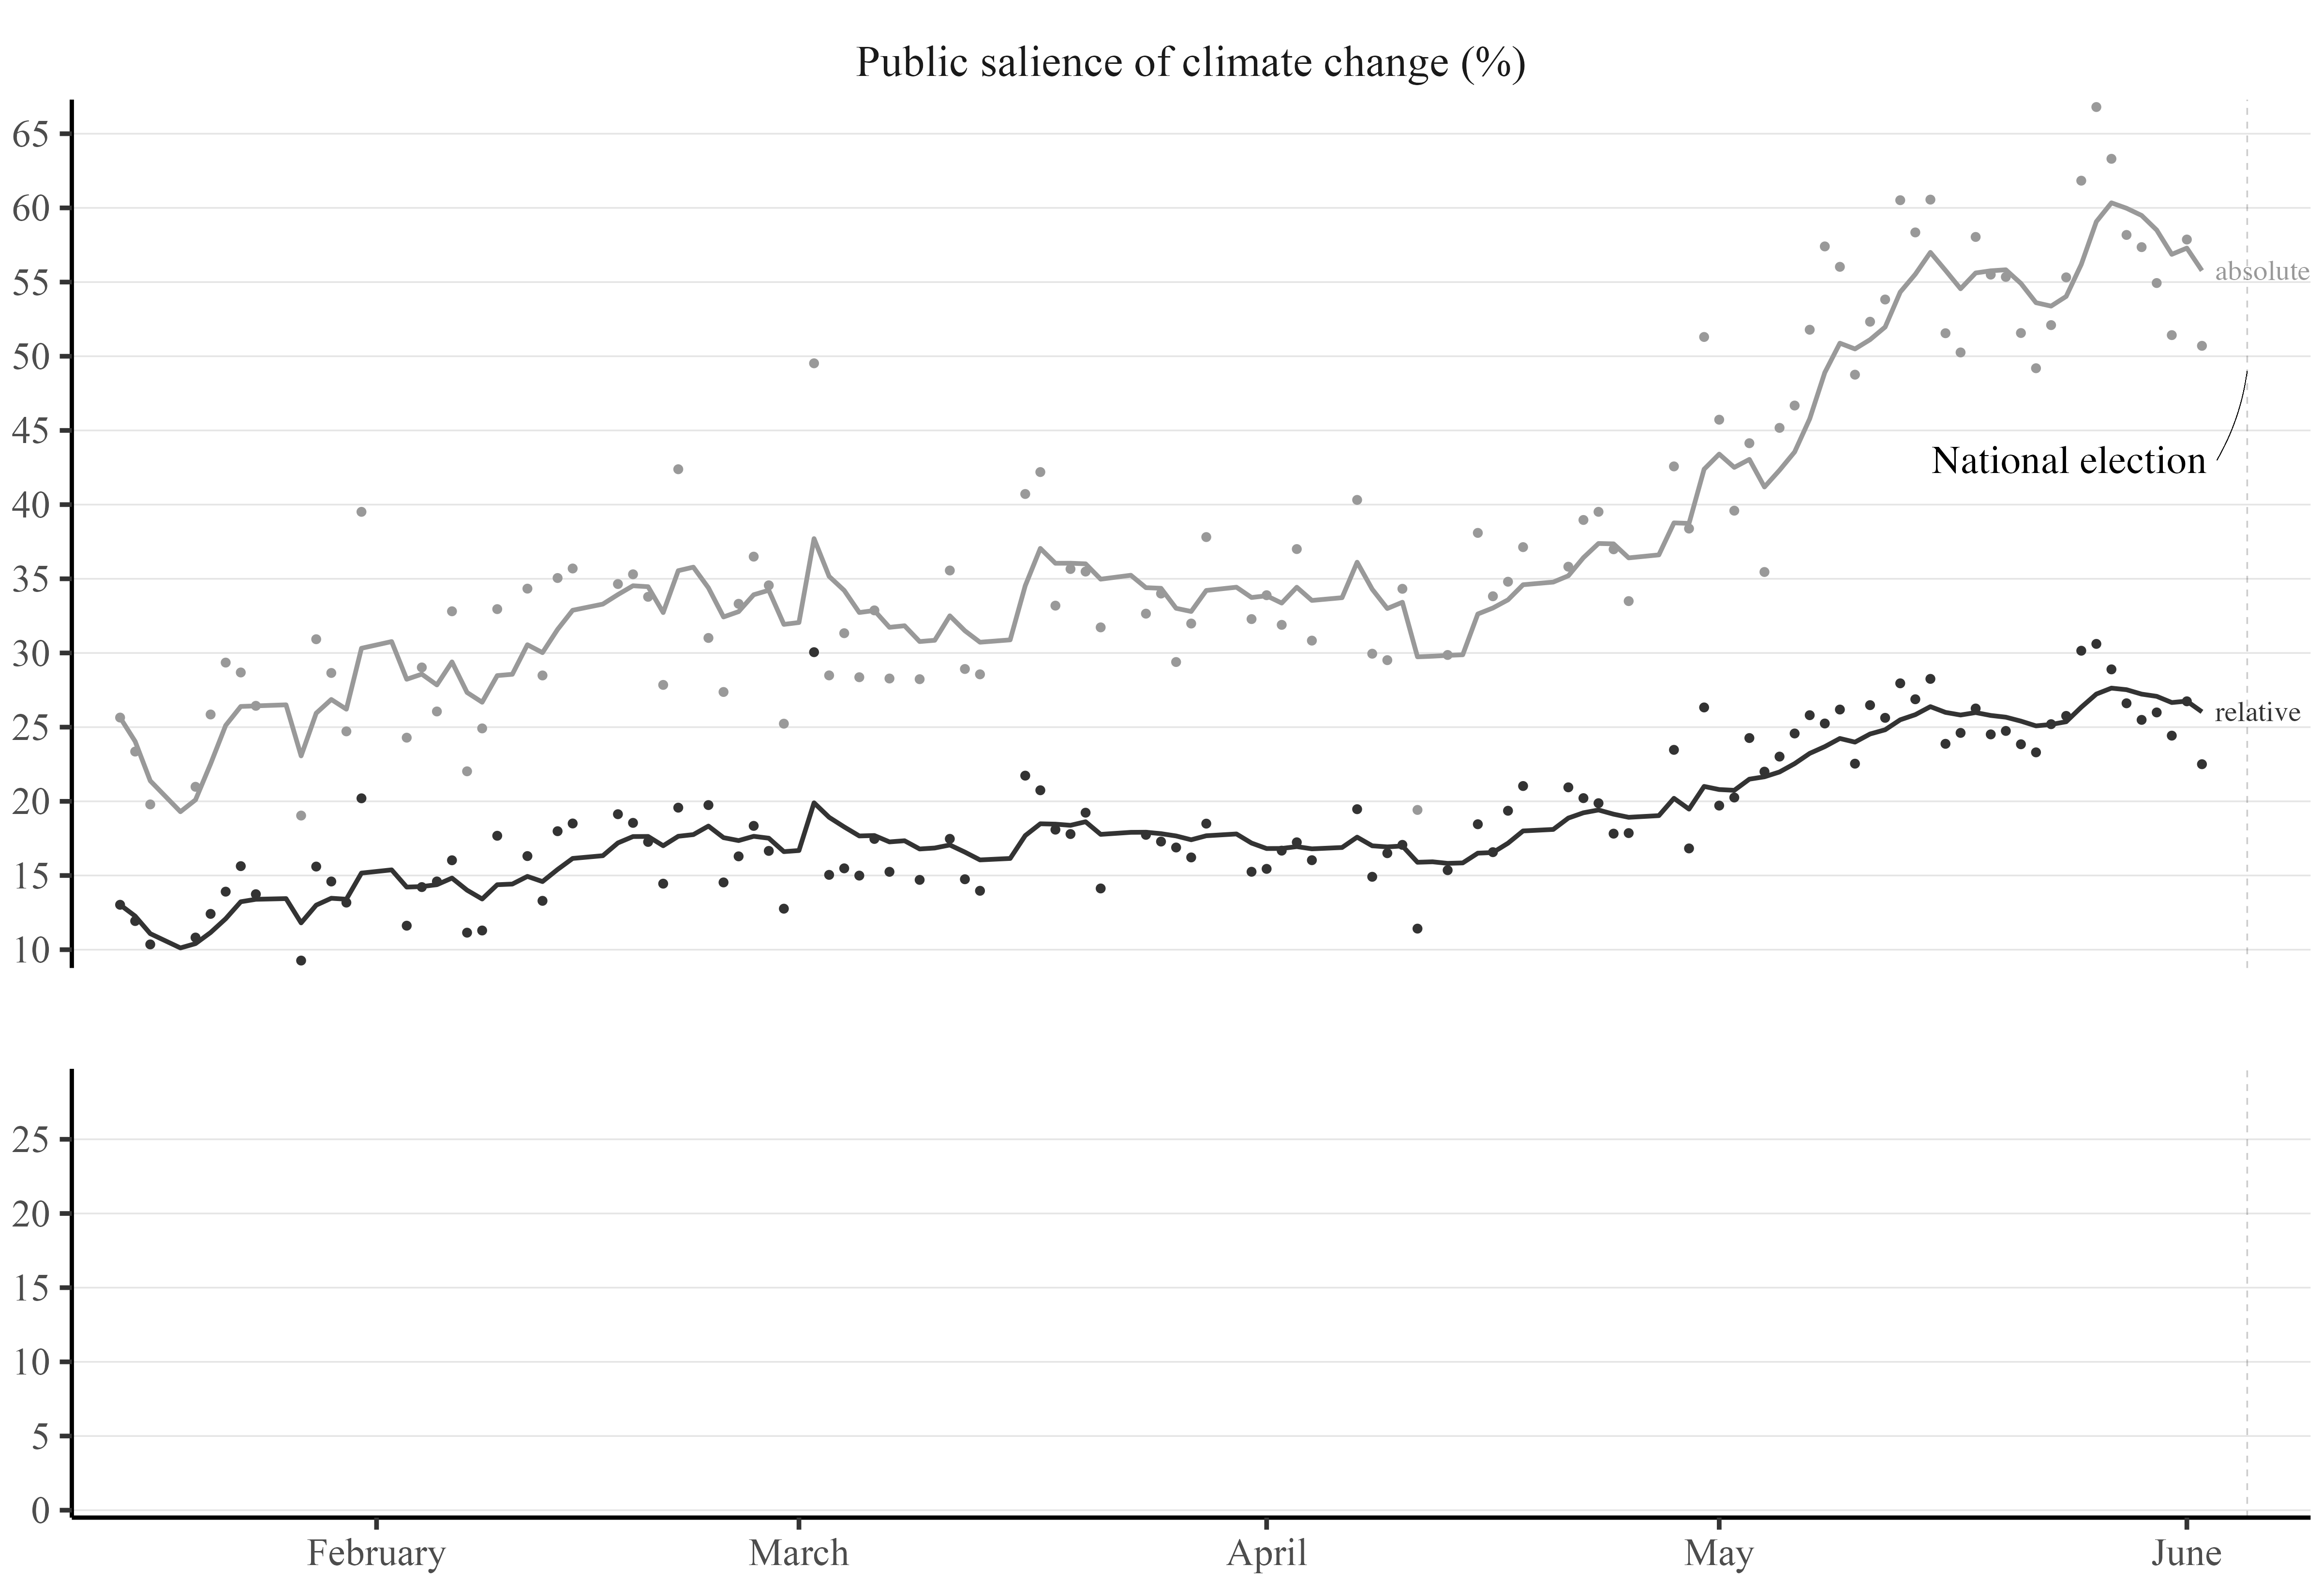
Climate change’s rapid rise in 2019
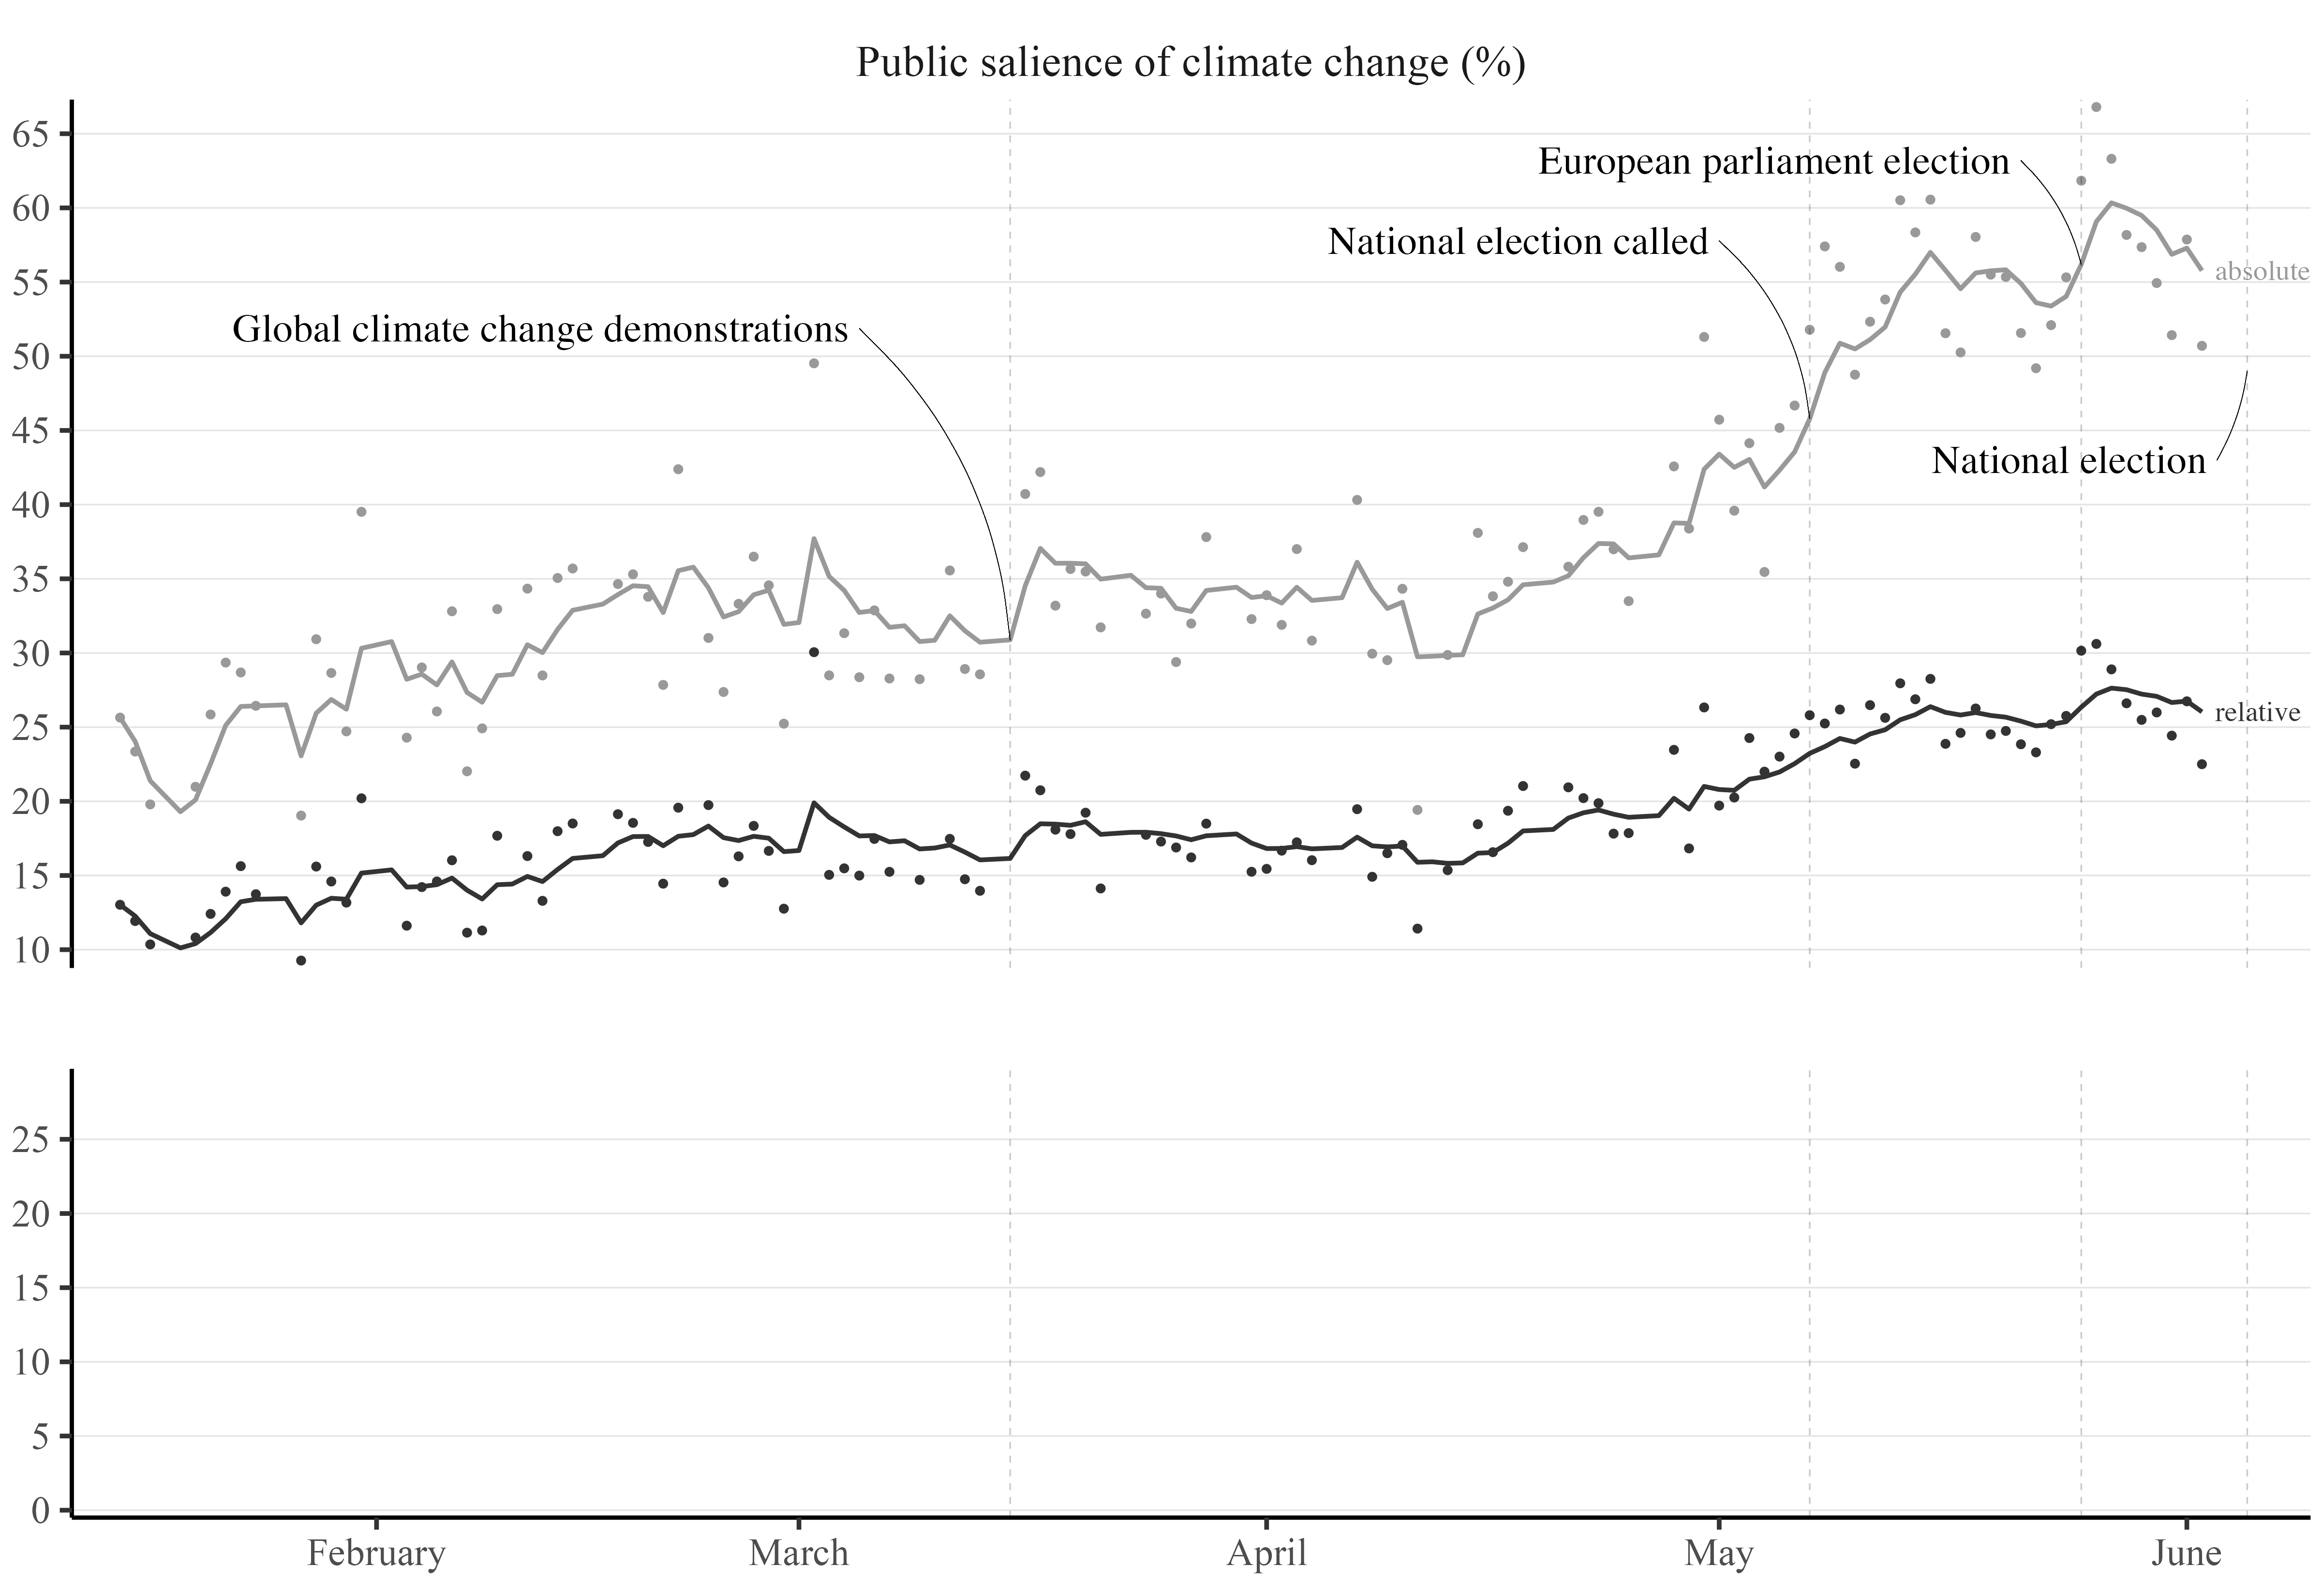
- Spotting the connection is hard
- Statistical analysis is needed
<Section 8.2 shows weekly media coverage, Section 8.3 shows decomposed time series>
A quick summary –
Does mass media coverage of climate change increase public salience?
- Yes, media climate coverage can drive public salience
- Concentrated among attentive citizens
→ limit of media influence - “Real-world events” drive media coverage
- Major responsibility
<Supplementary material in Section 8>
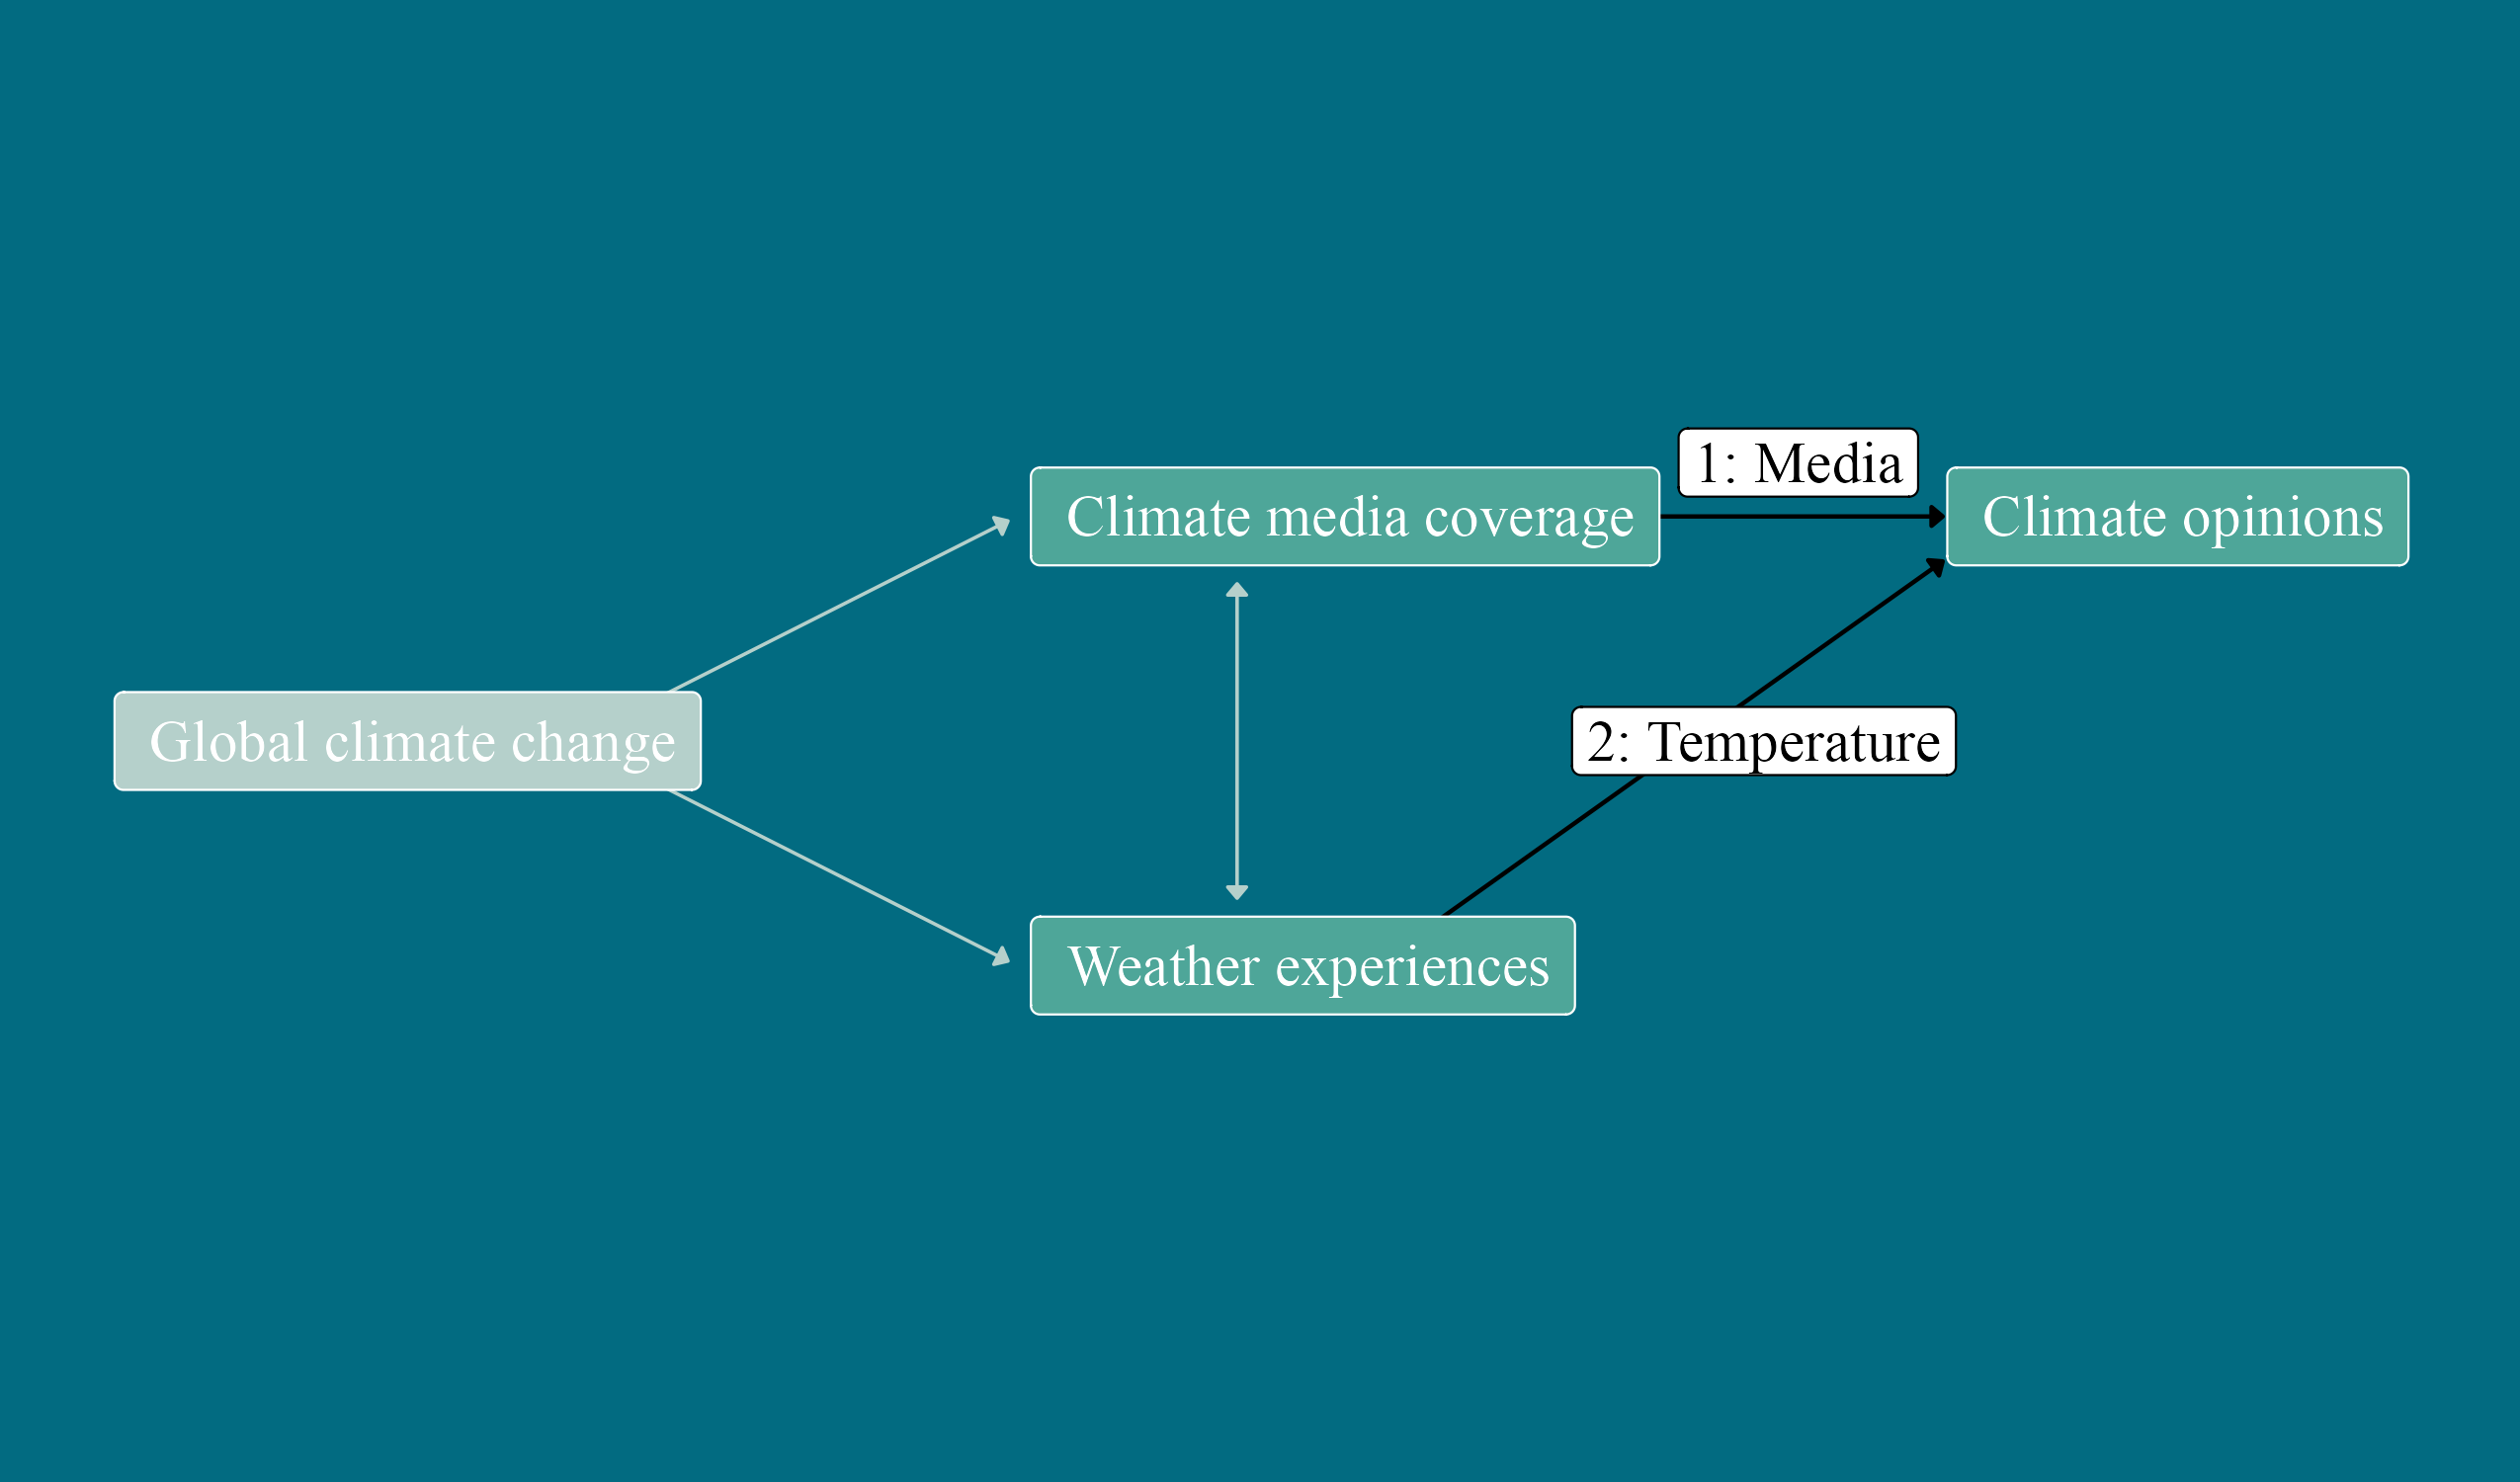
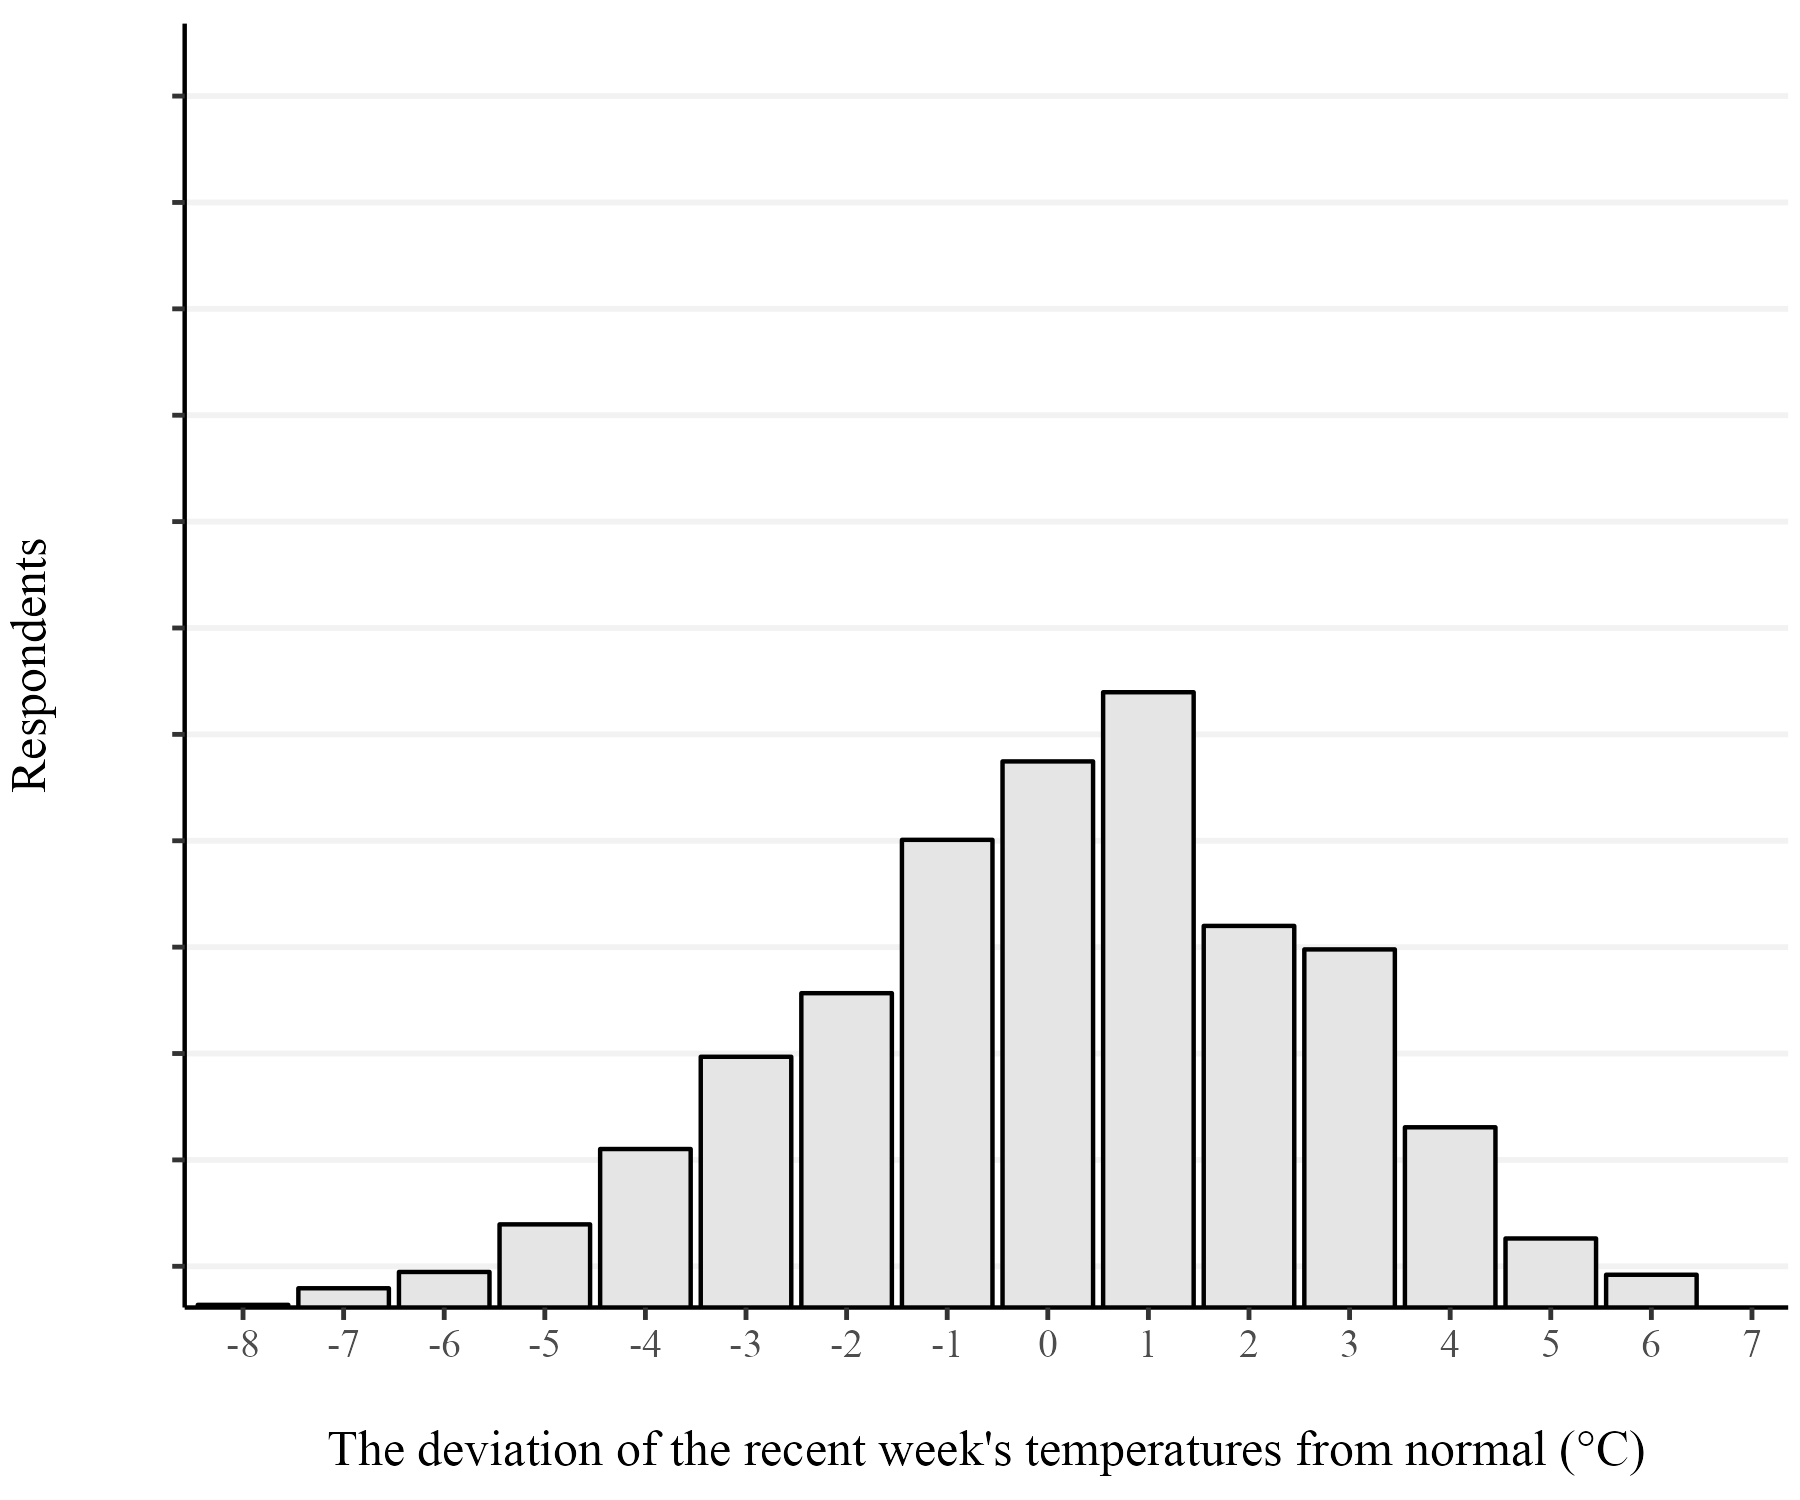
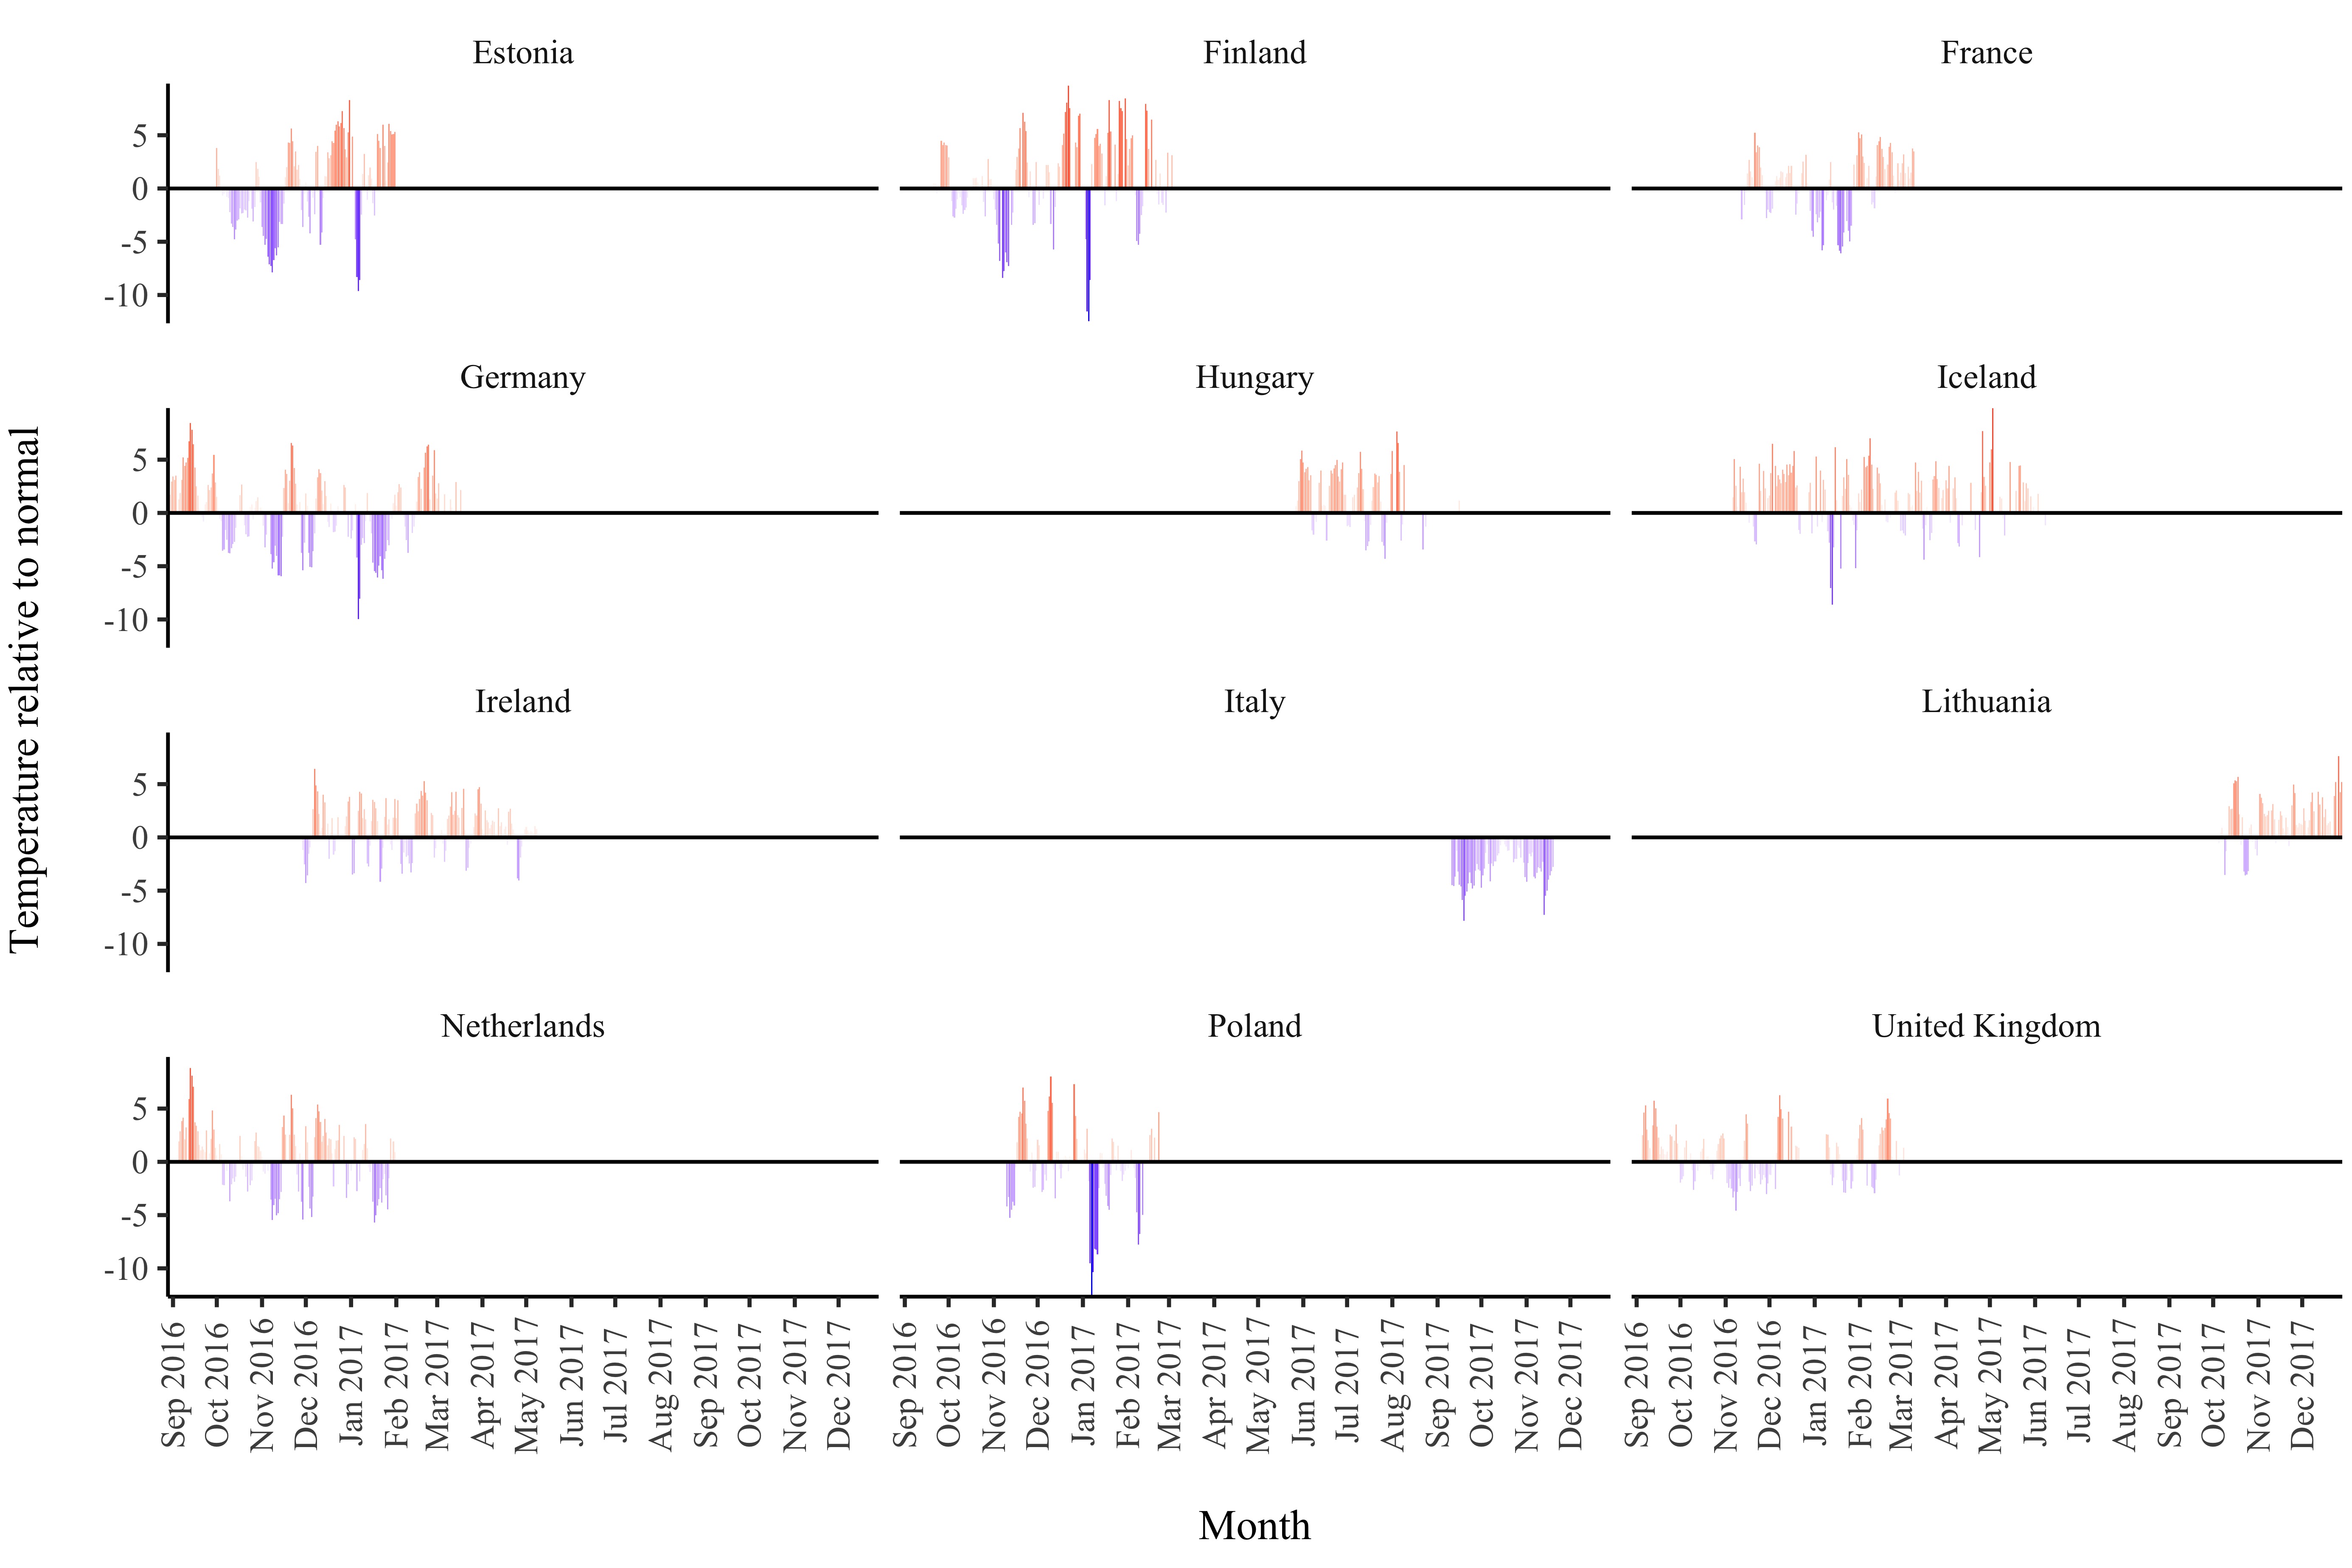
Article 2: Temperature
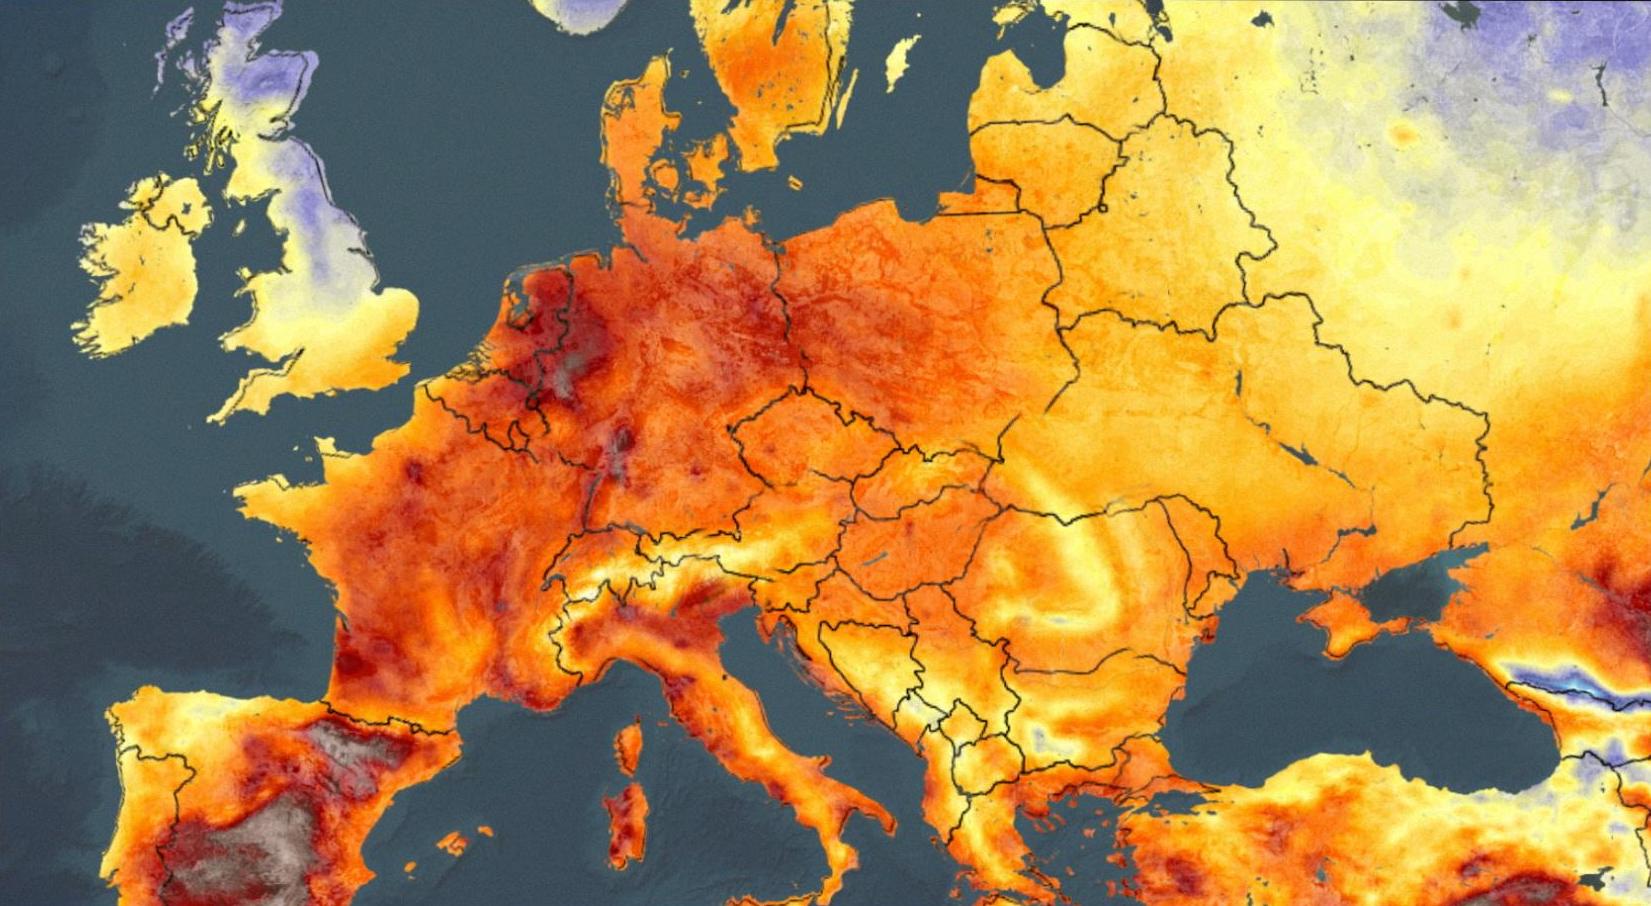
- “How weather experiences strengthen climate opinions in Europe”
- Published in West European Politics (2021)
- Extension of Egan & Mullin (2012)
Does warmer weather make us more climate conscious?
(prev. slide) Yahoo! News
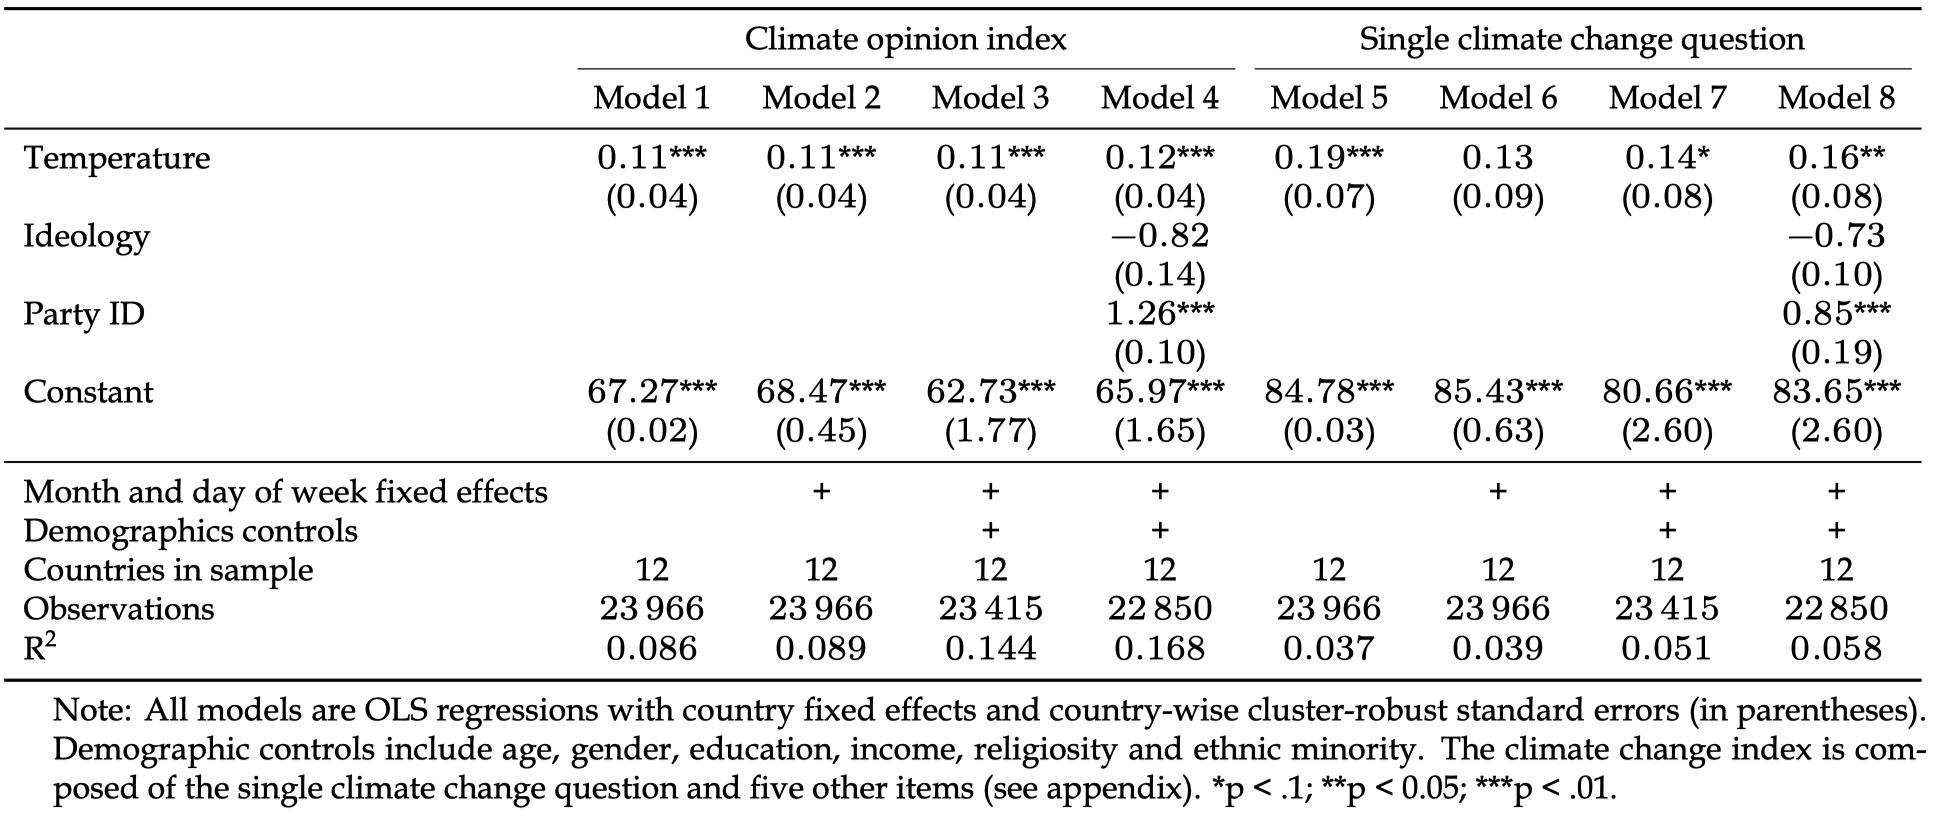
Results
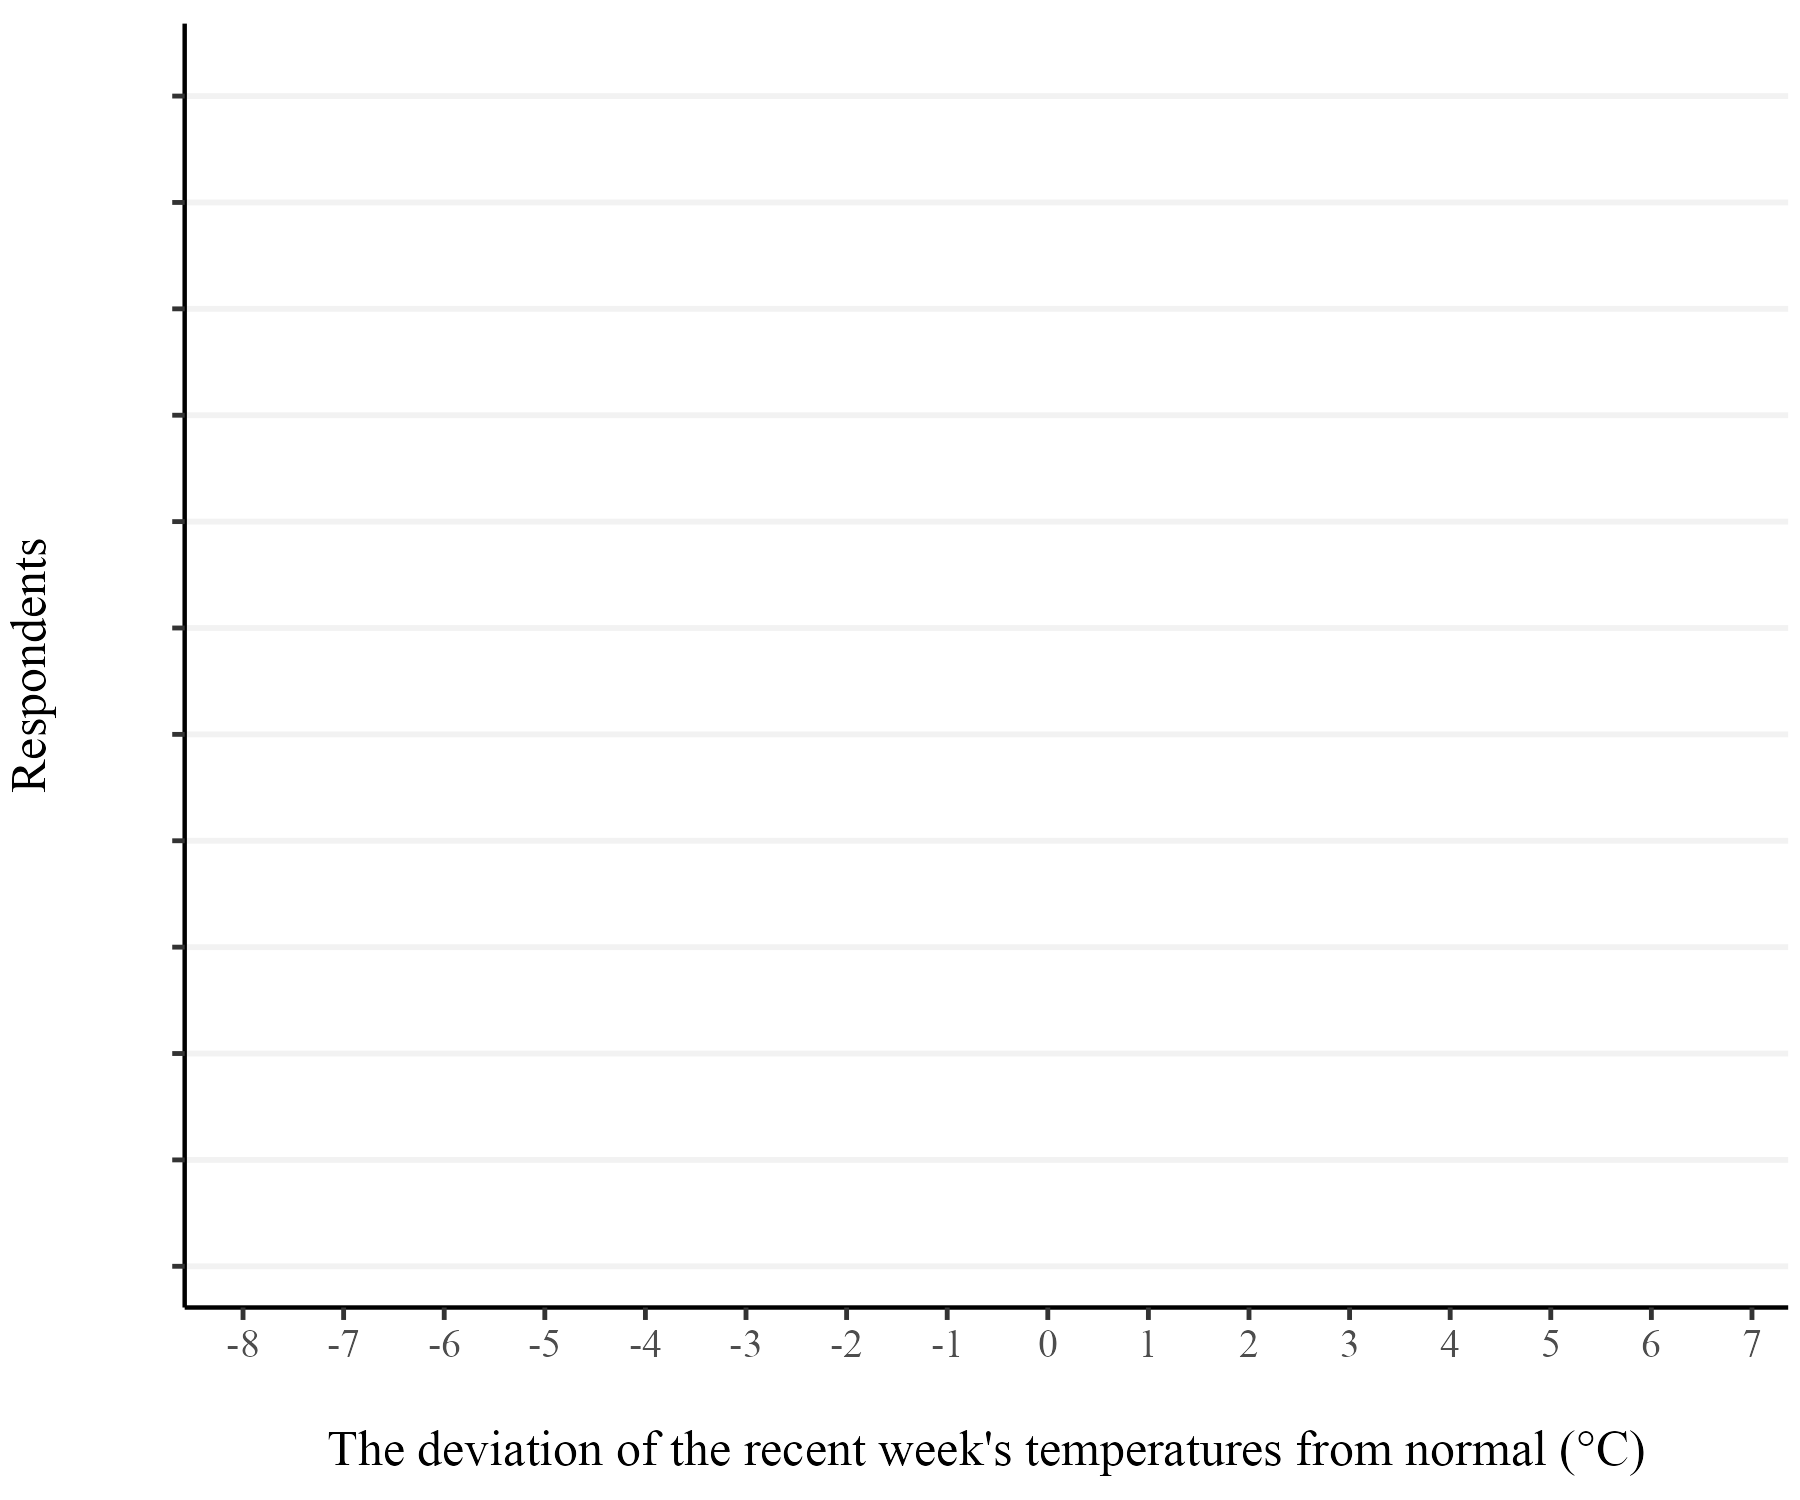
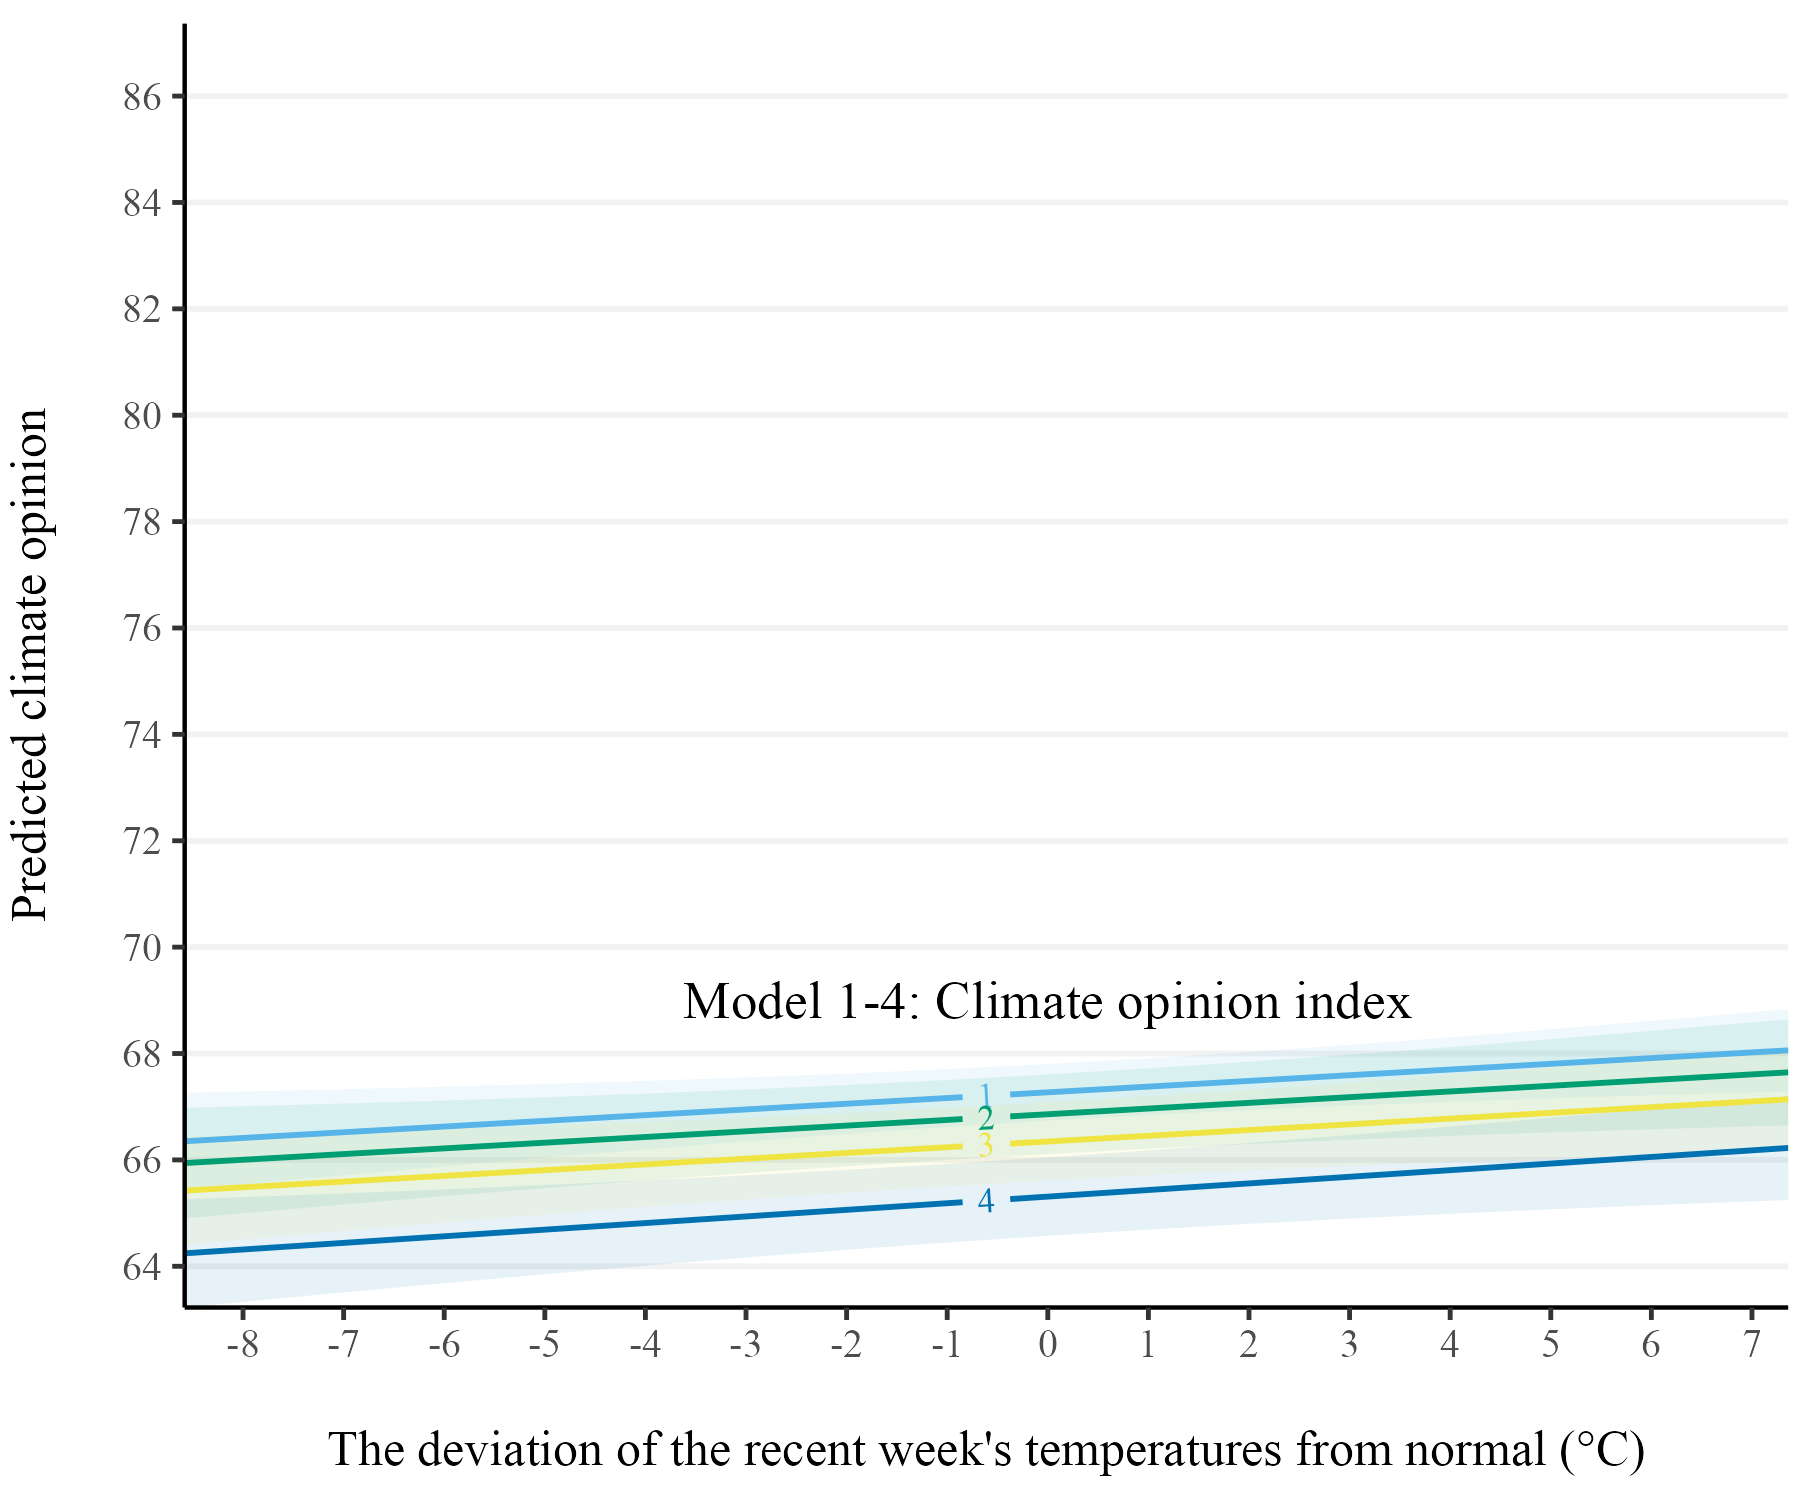
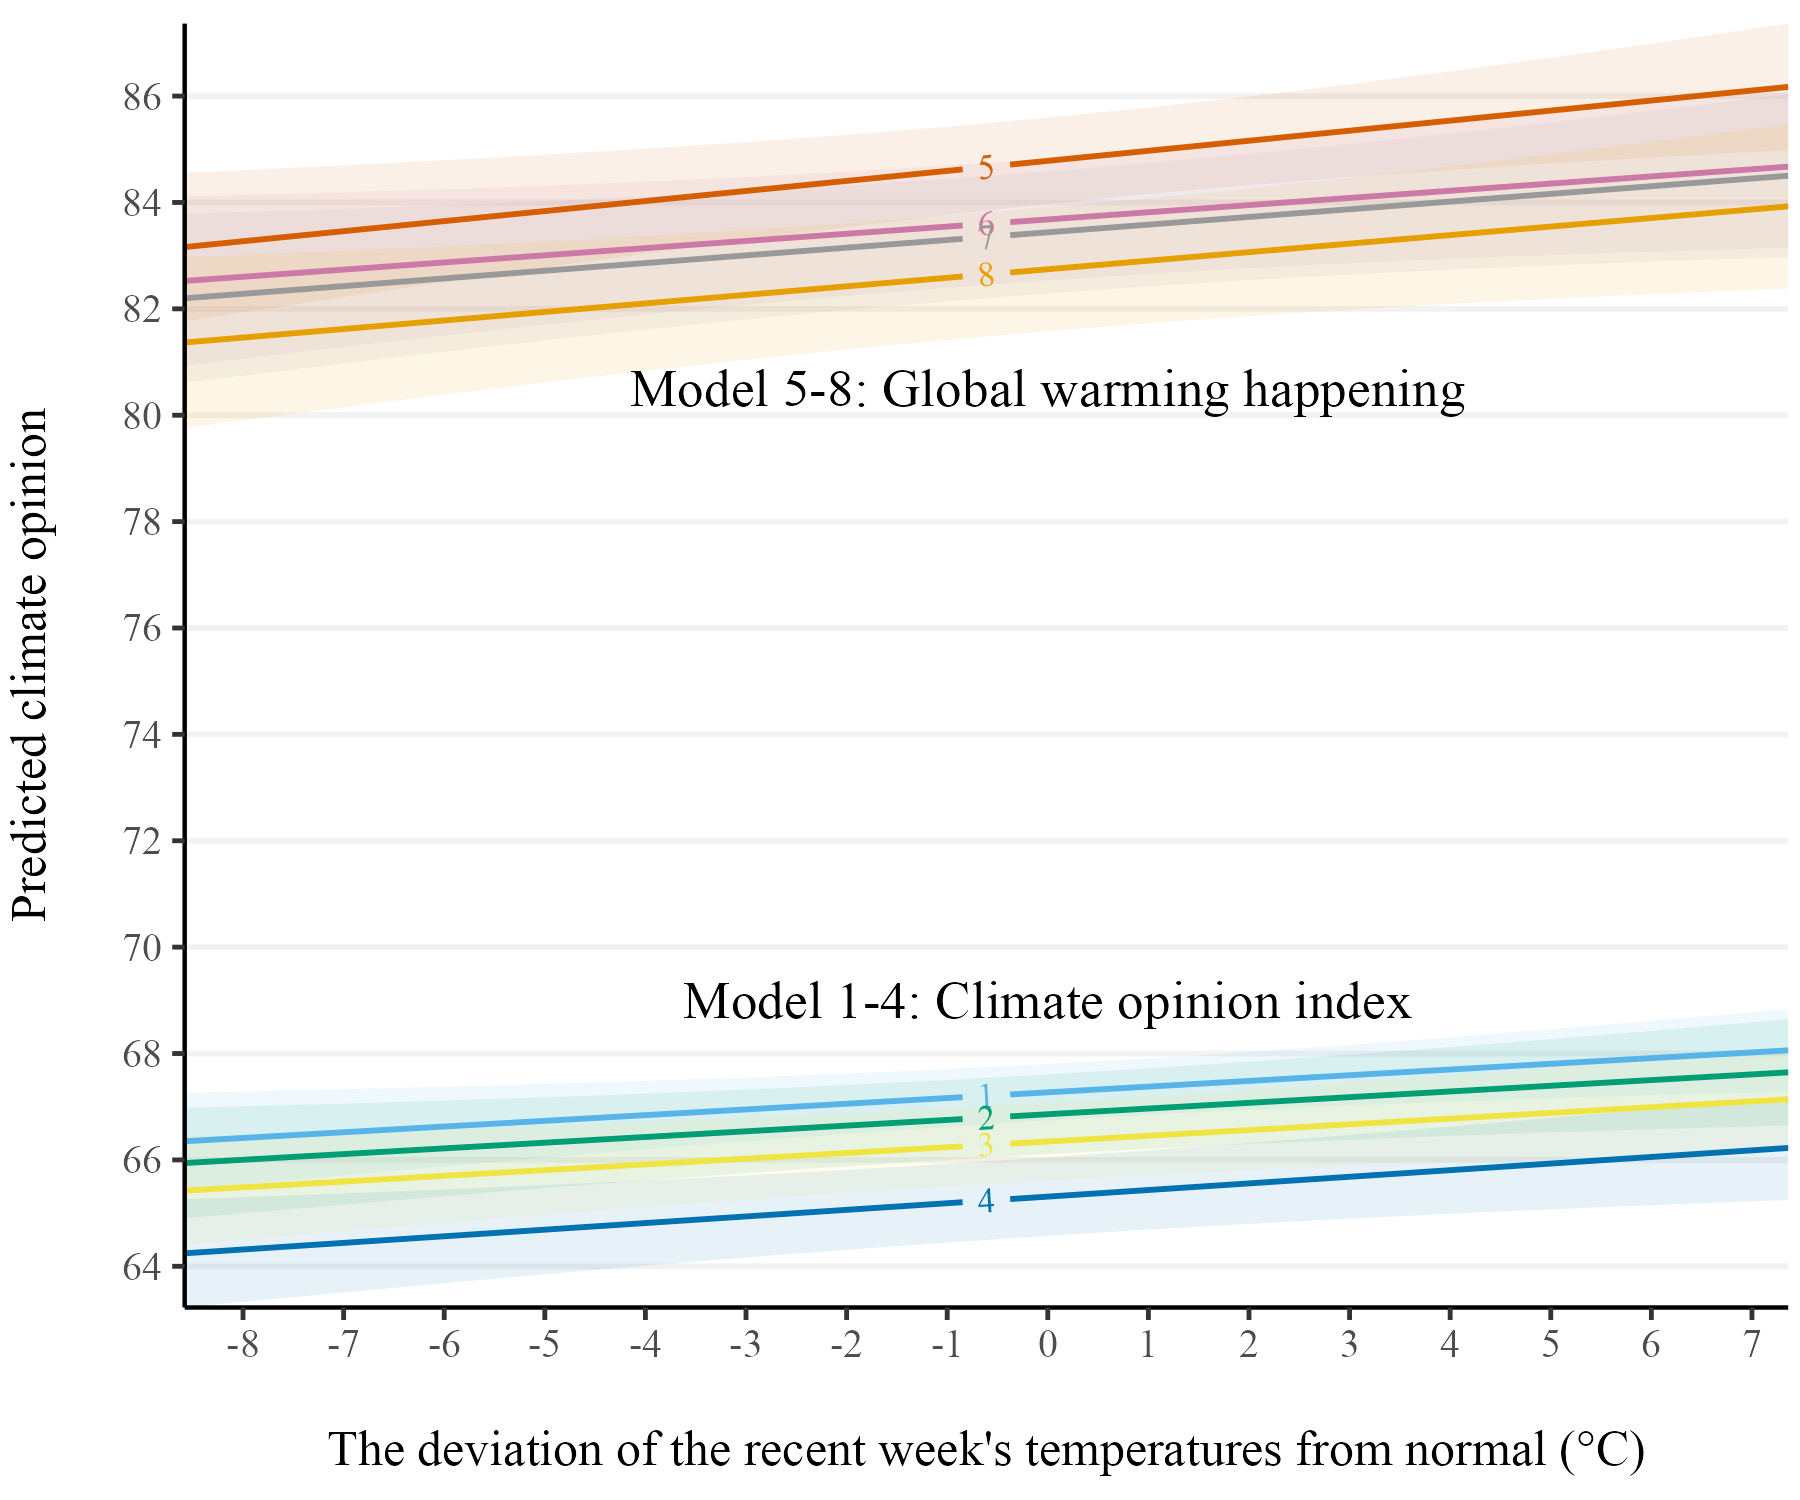
- Warmer-than-usual weather increase climate awareness
- 5°C temperature shift
strengthens climate
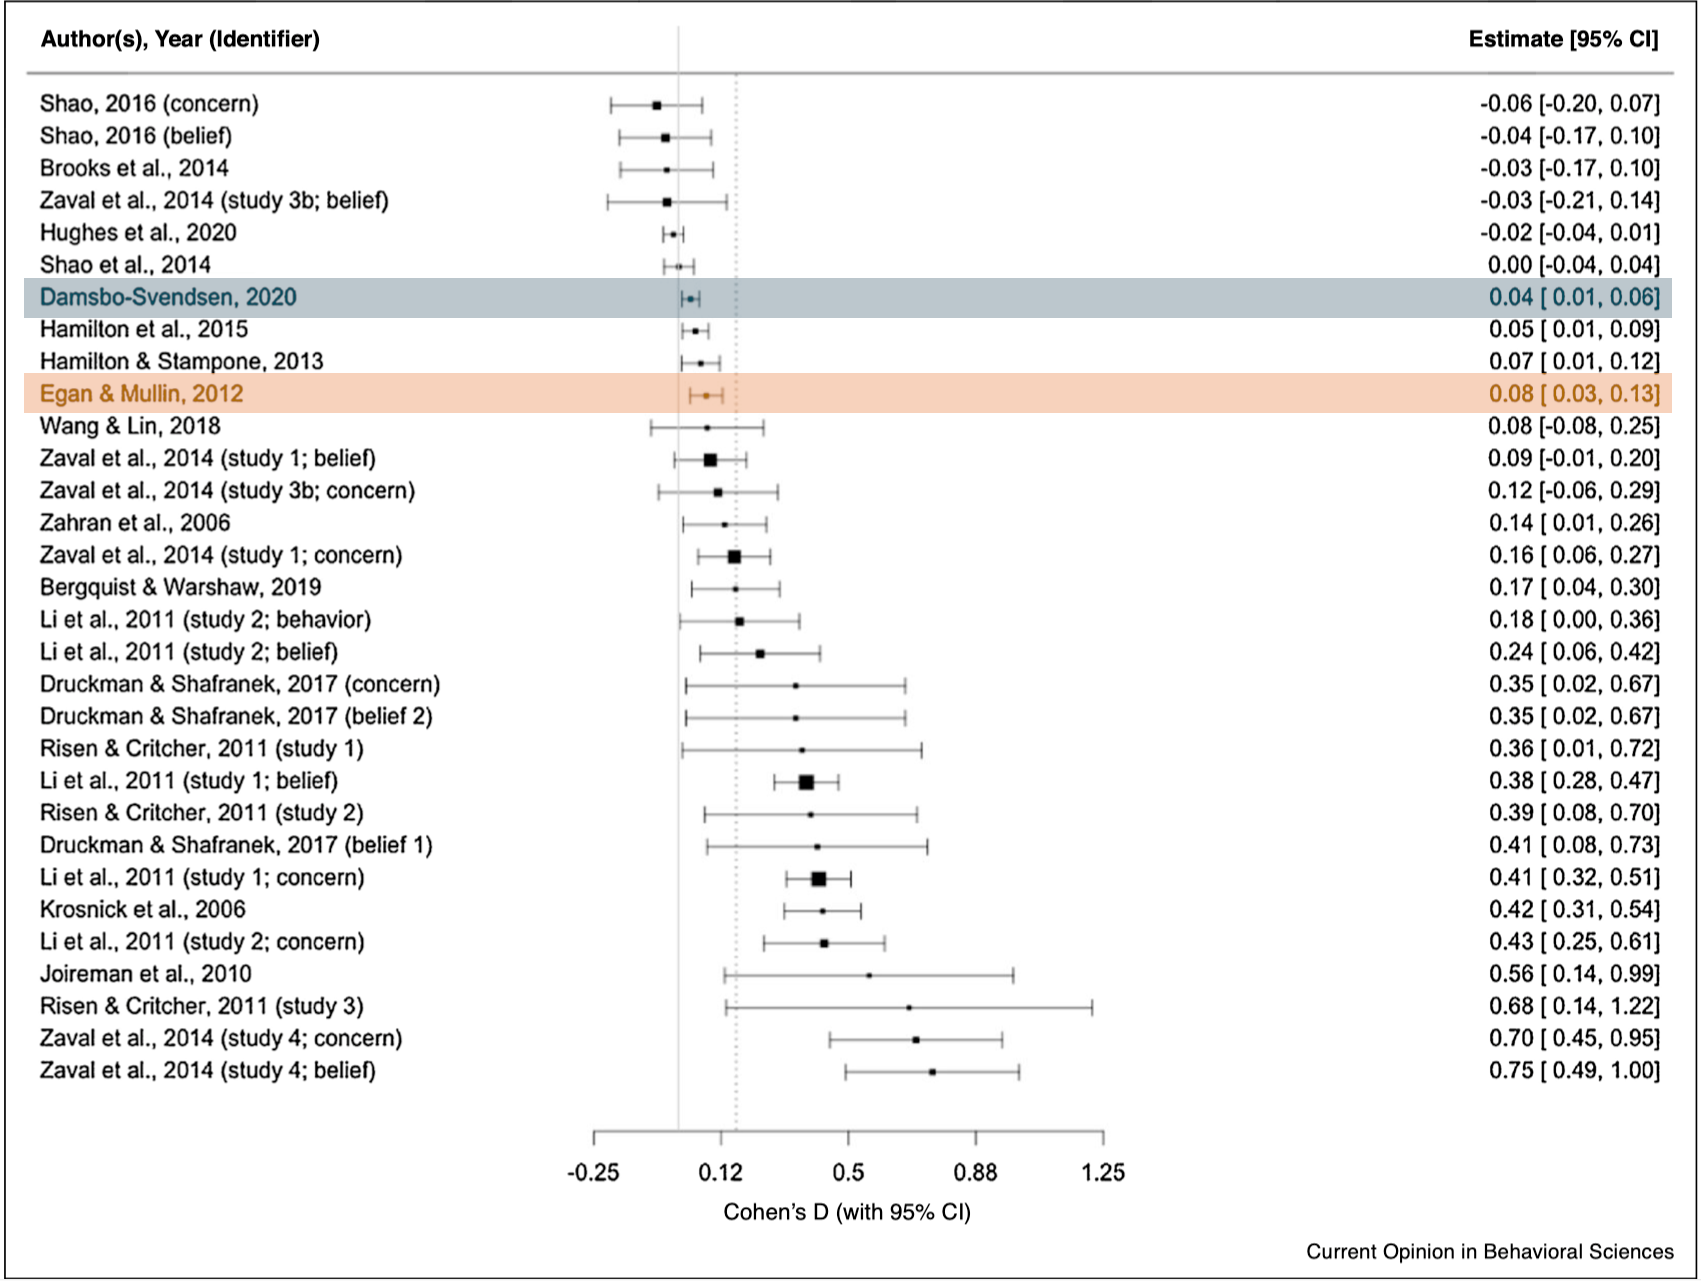
opinions by 0.5–1.0 - Small effect, but …
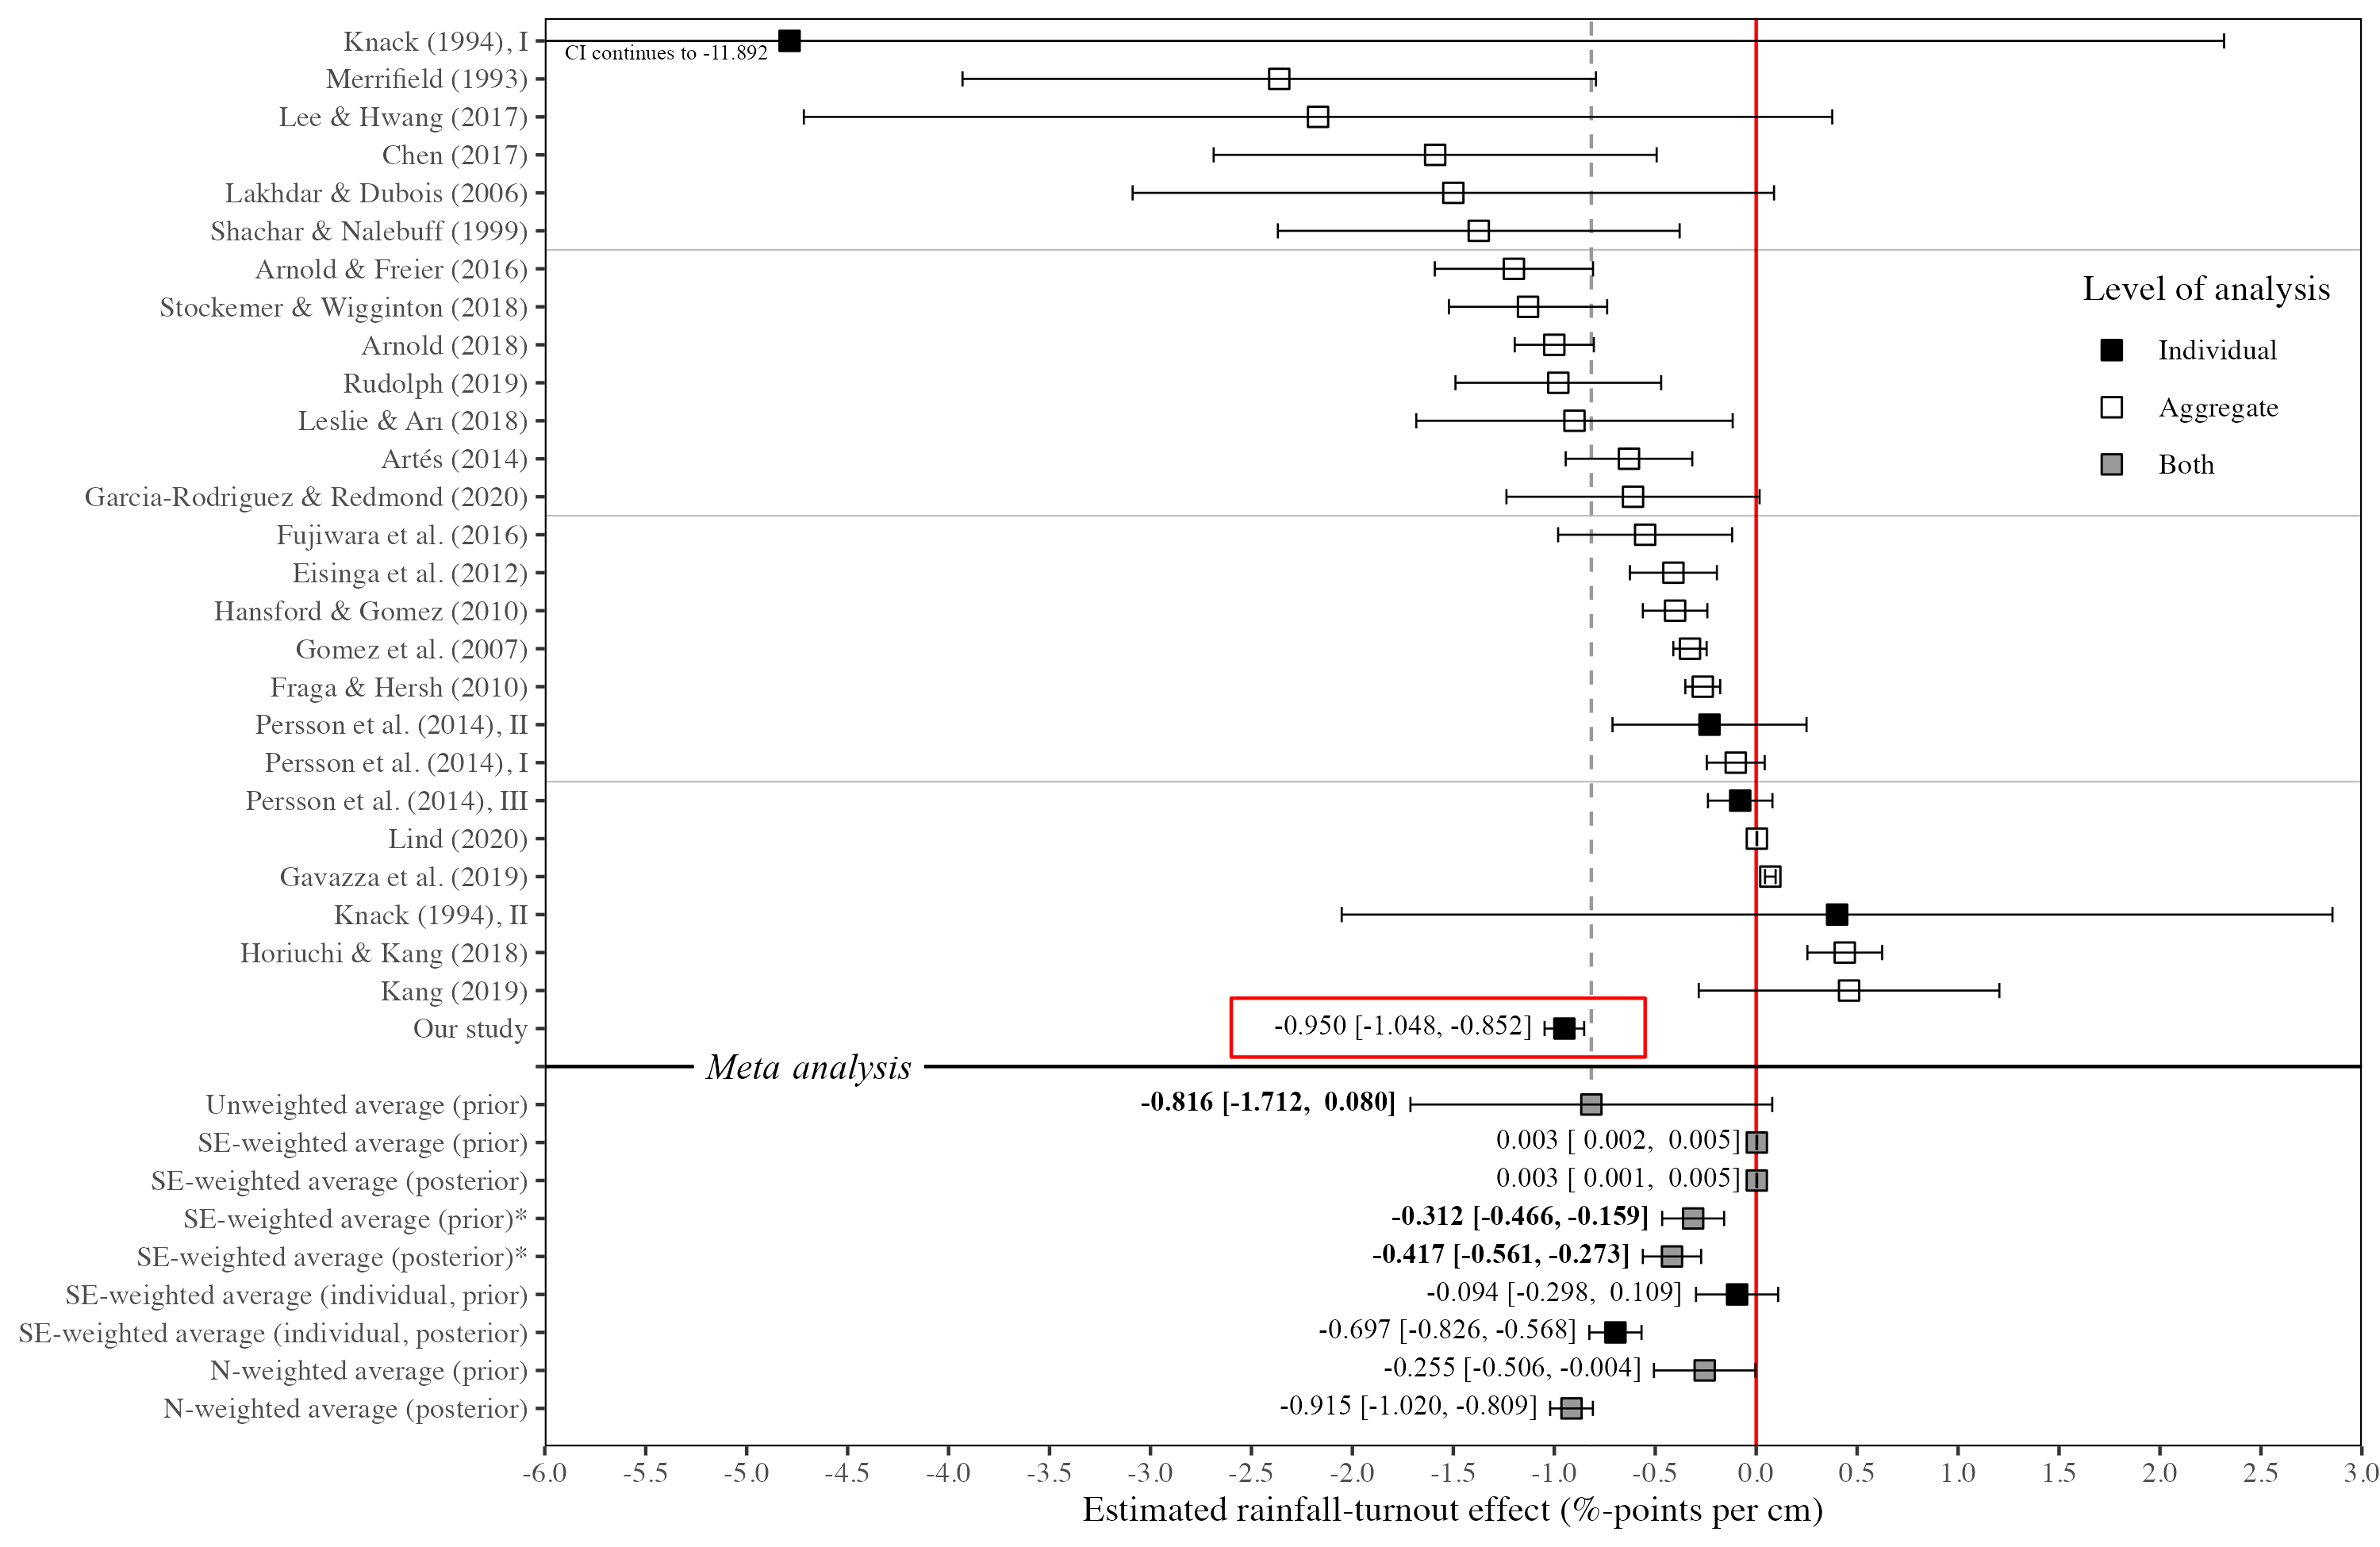
<Section 9.5 shows a meta-analysis>
Who is affected?
Who is affected?

- Only suggestive evidence
- Temperatures affect everybody
A quick summary –
Does warmer weather make us more climate conscious?
- Yes!
- Across 12 European countries
- Robust effect of warmer-than-normal temperatures
- Same for everyone
<Supplementary material in Section 9>
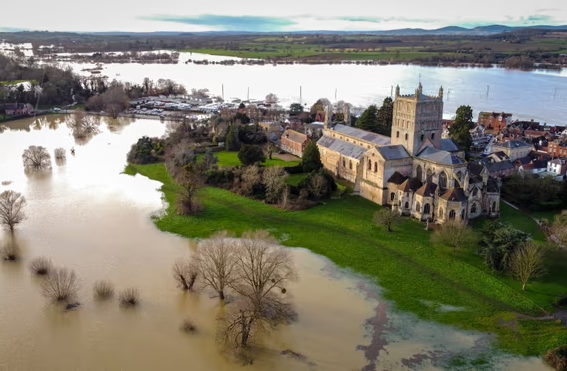
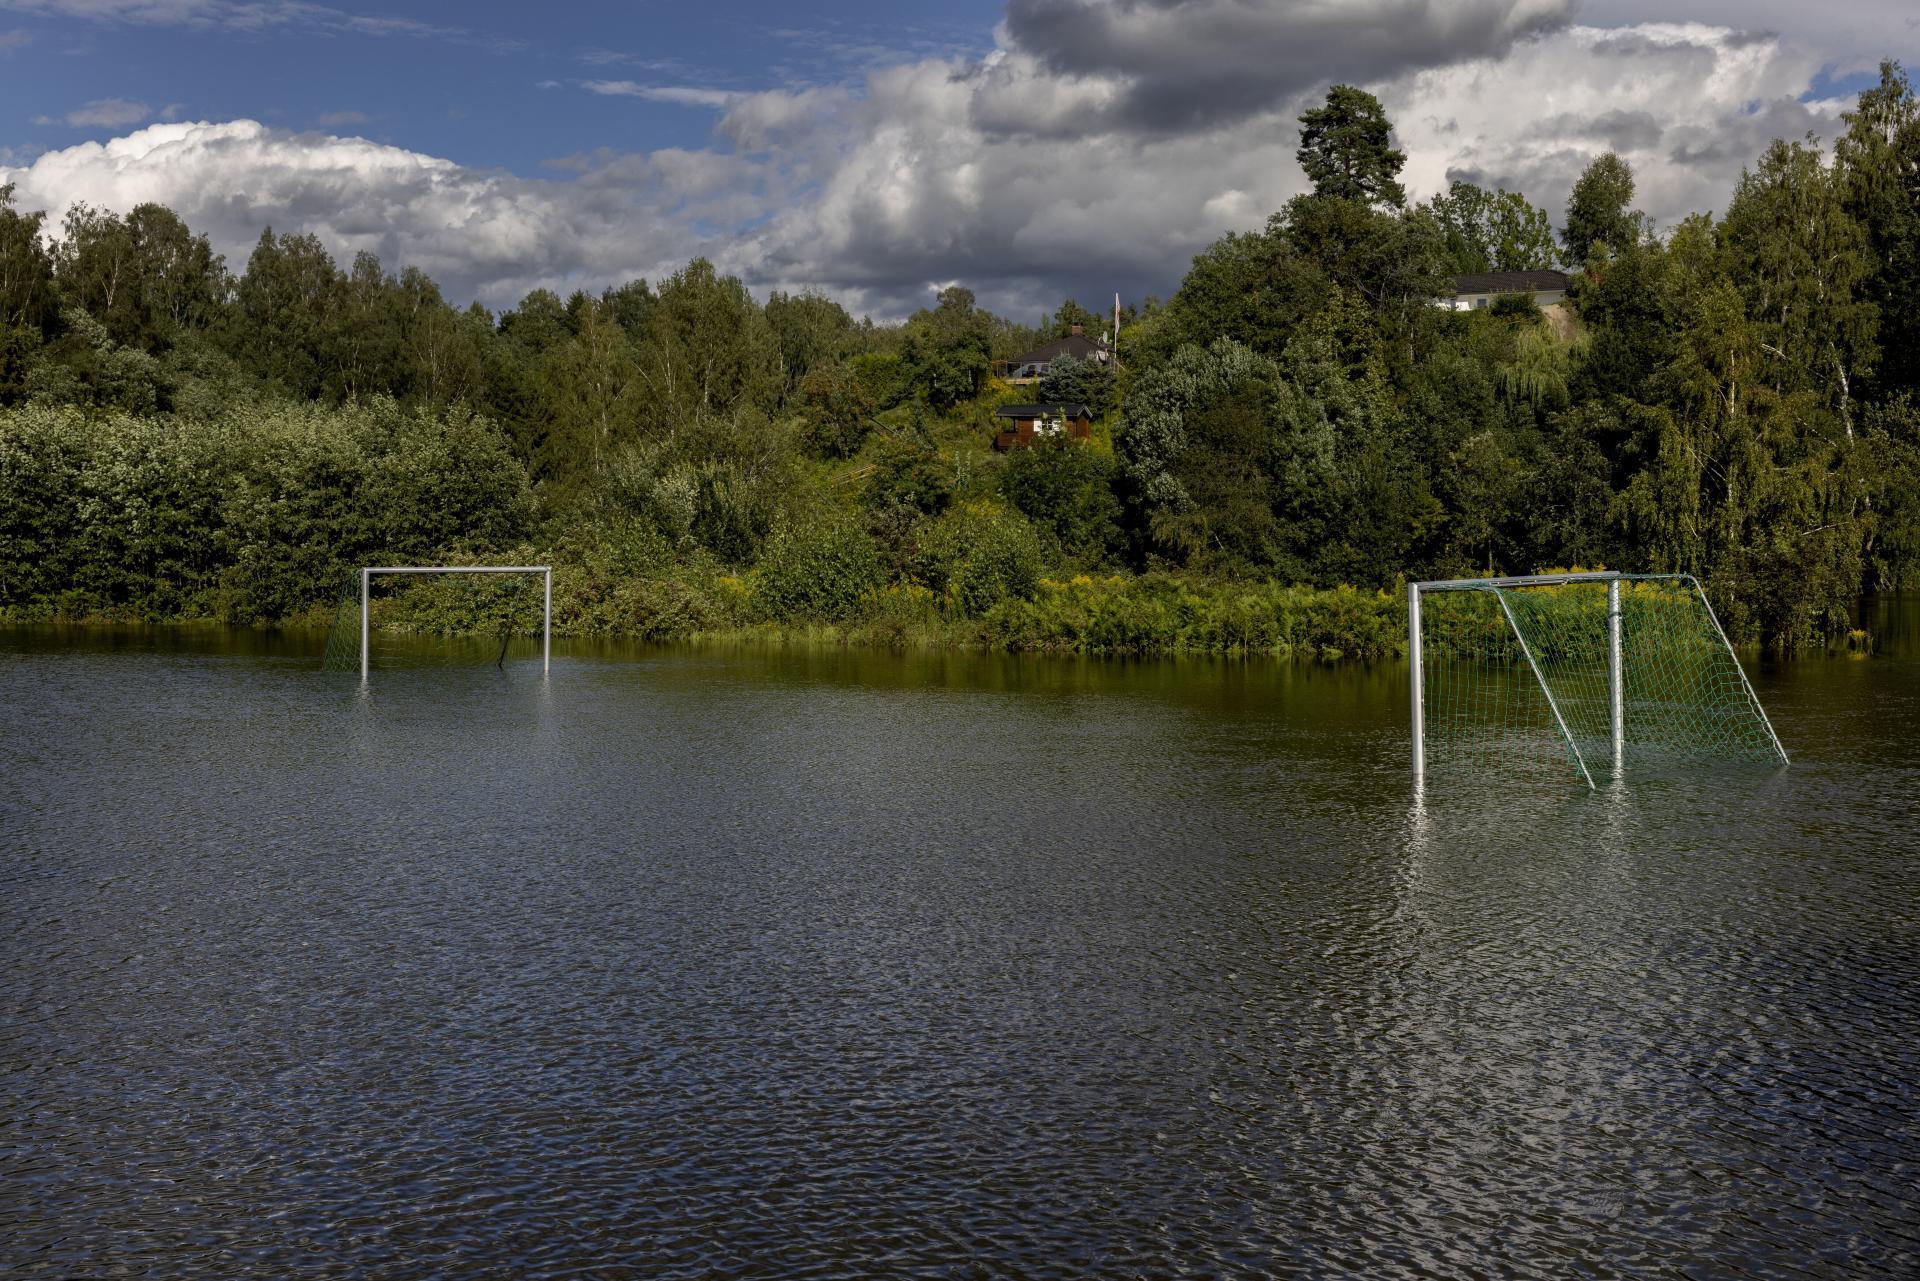
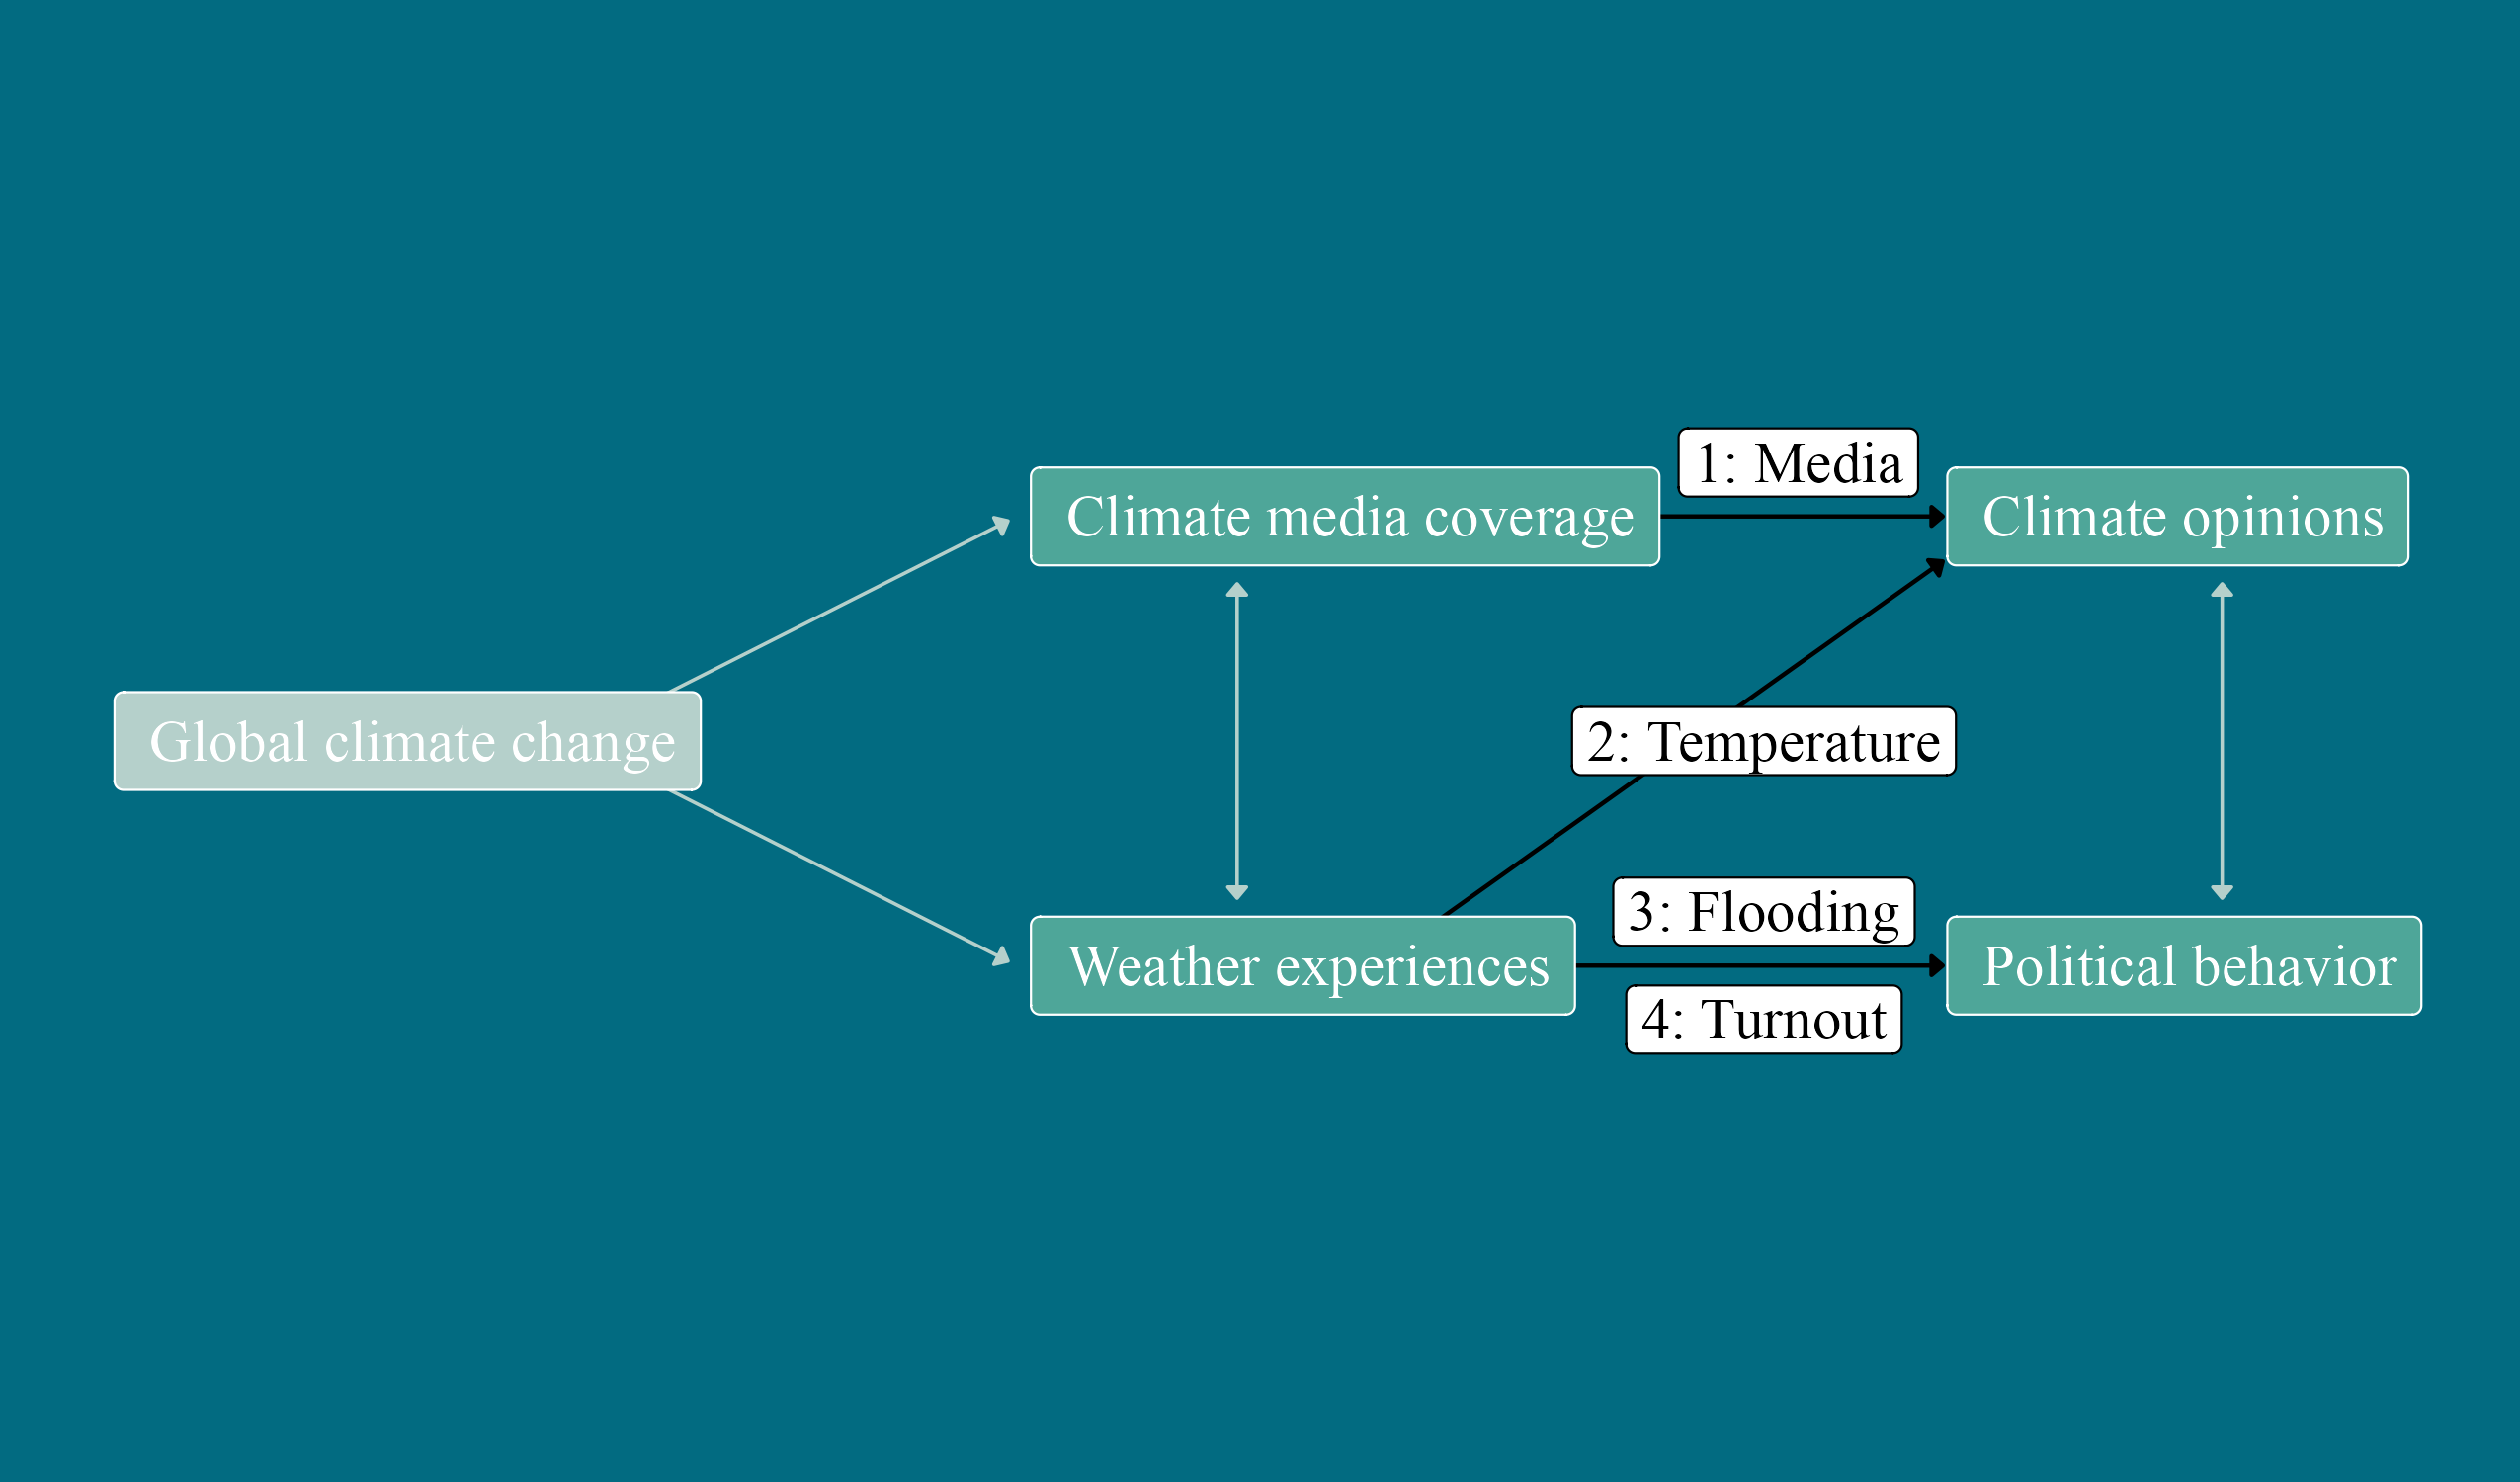
Article 3: Flooding
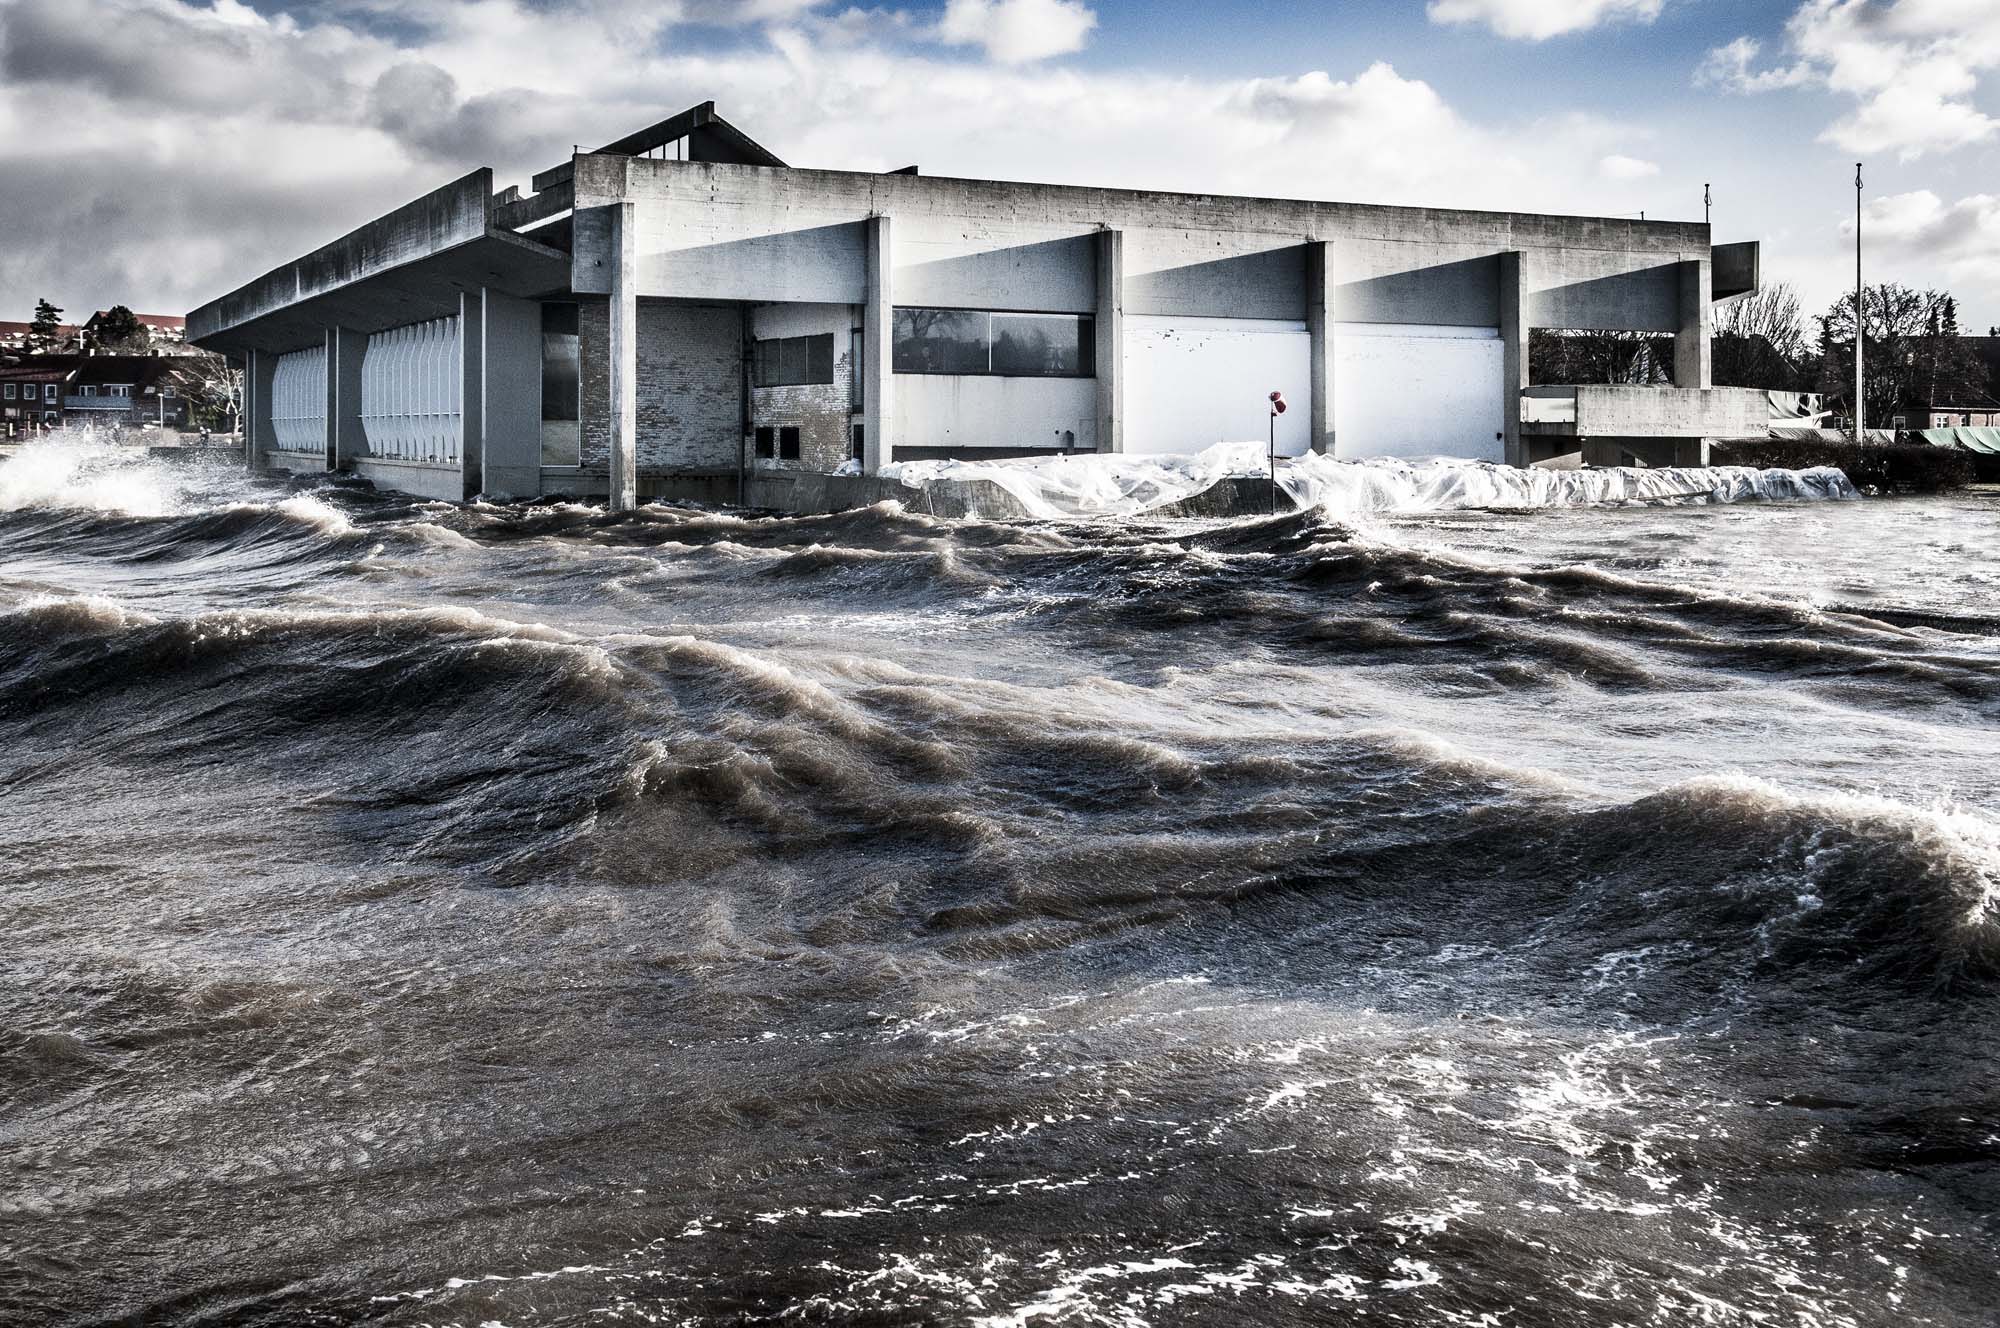
- “Pro-climate voting in response to local flooding”
- Published in Political Behavior (2024)
Does local flooding experience lead to pro-climate voting?
(prev. slide) Vikingeskibsmuseet
![]()
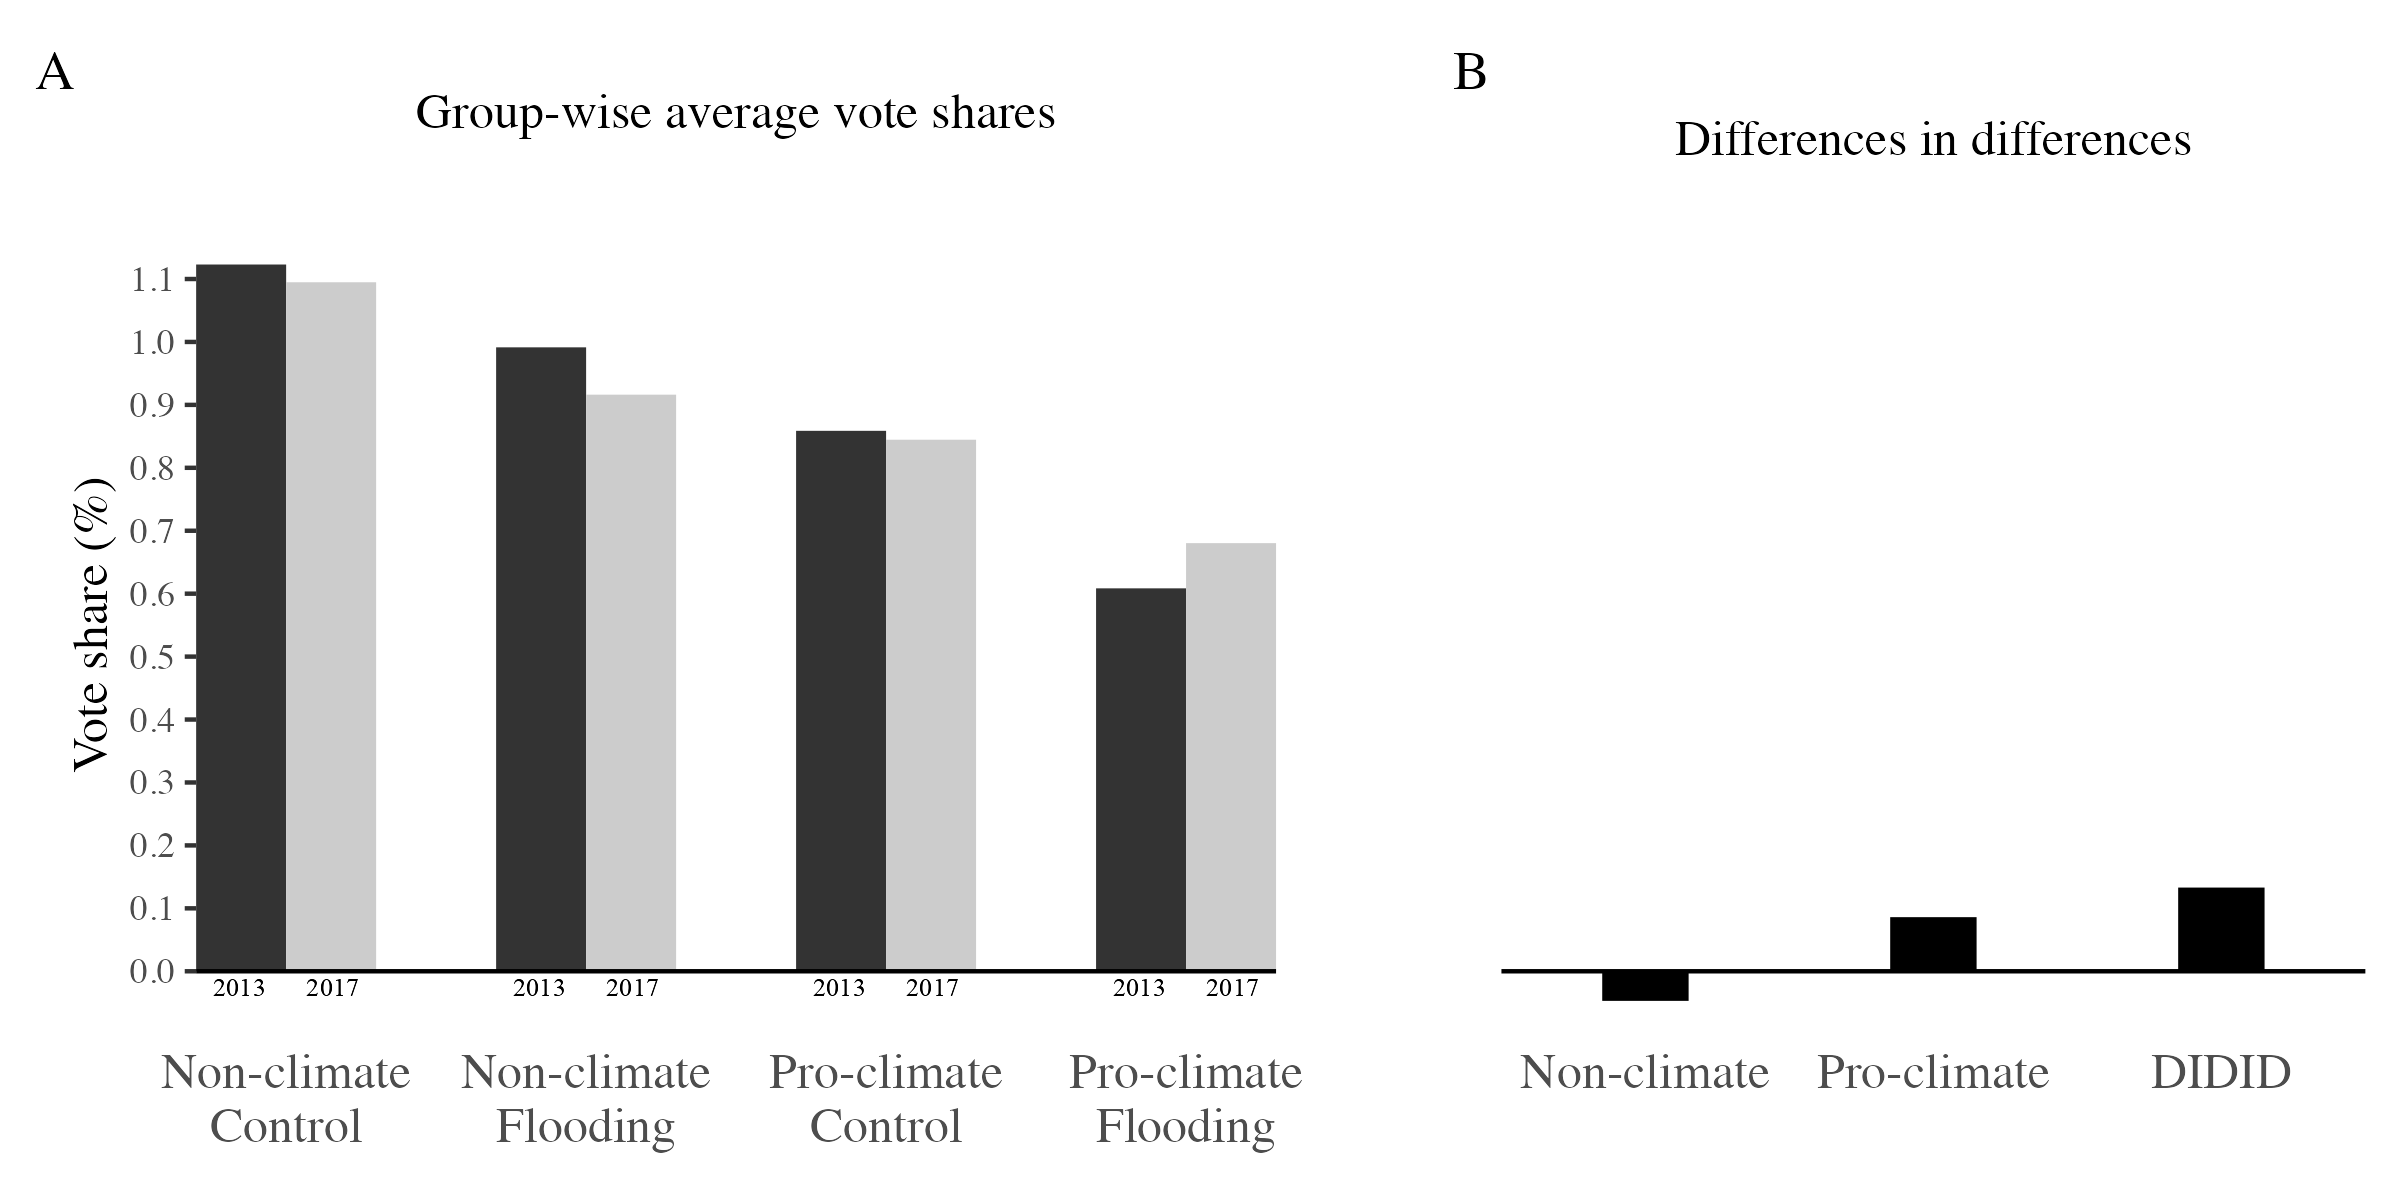
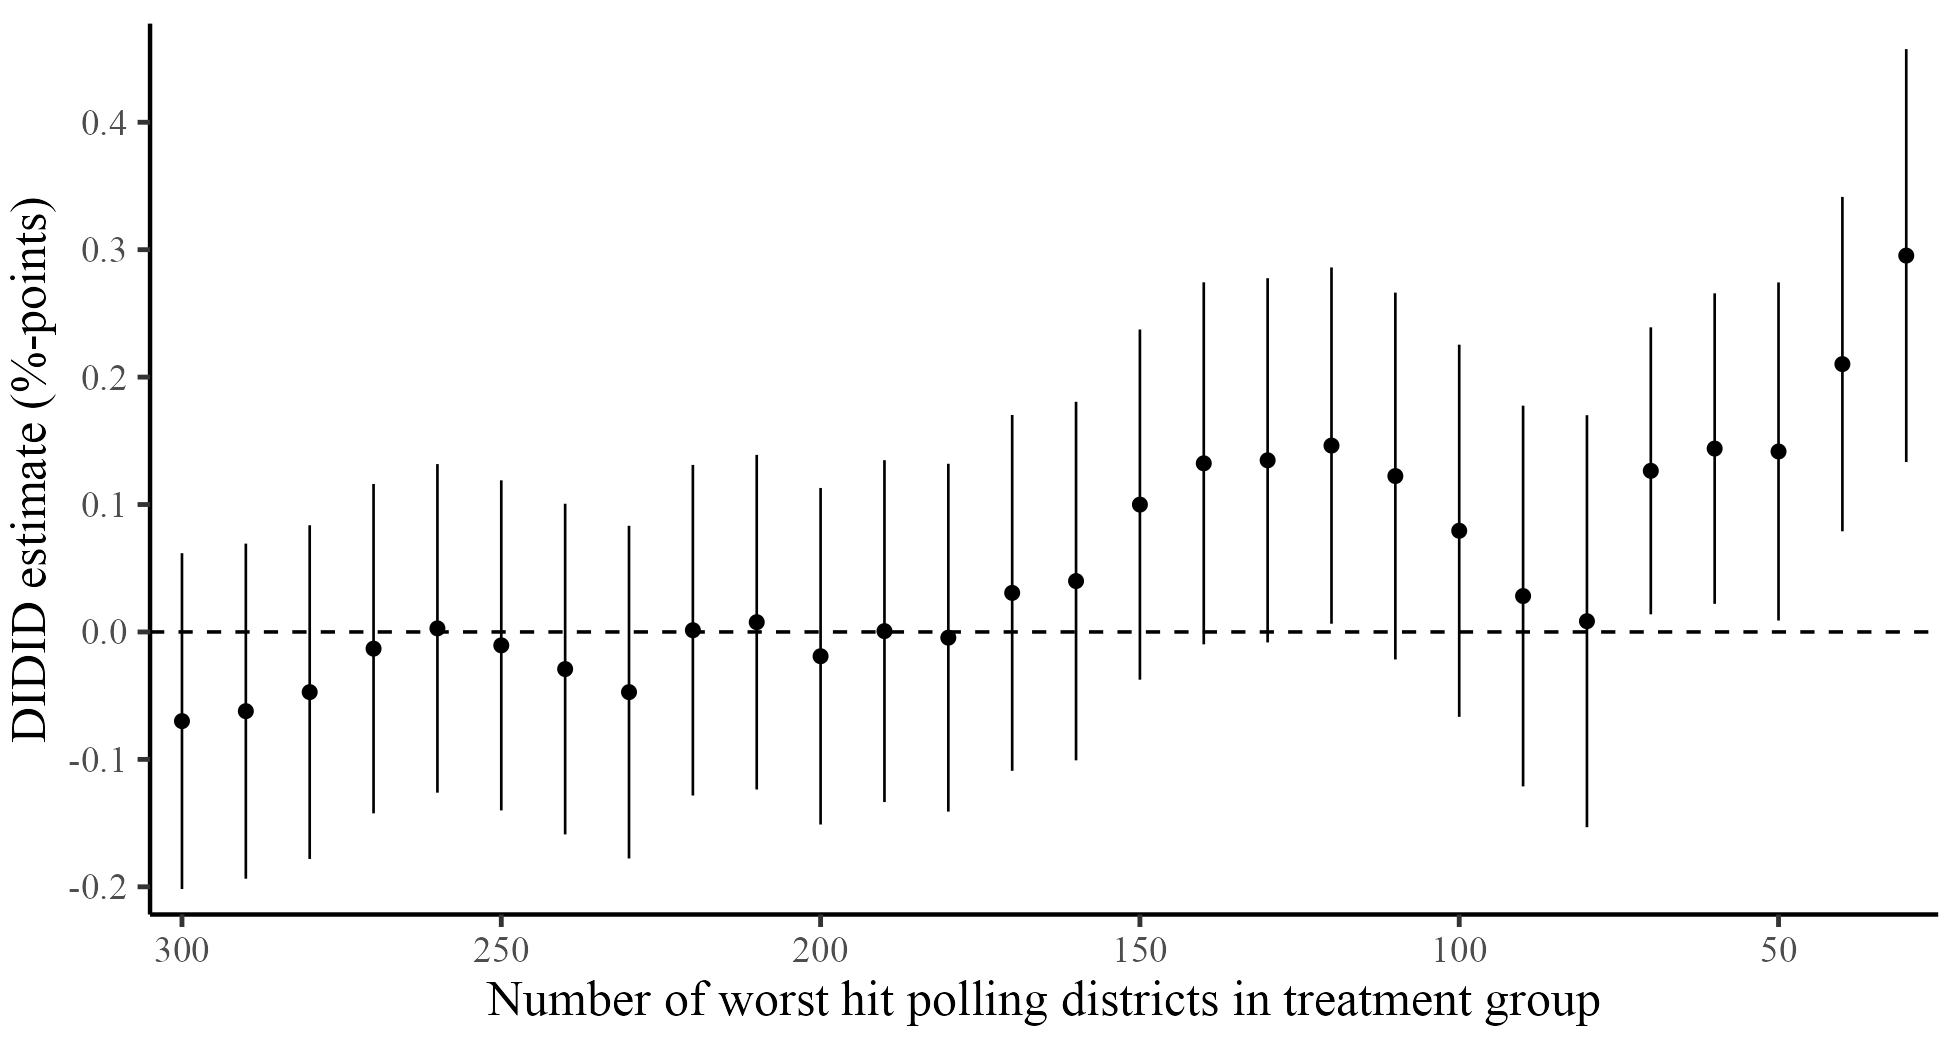
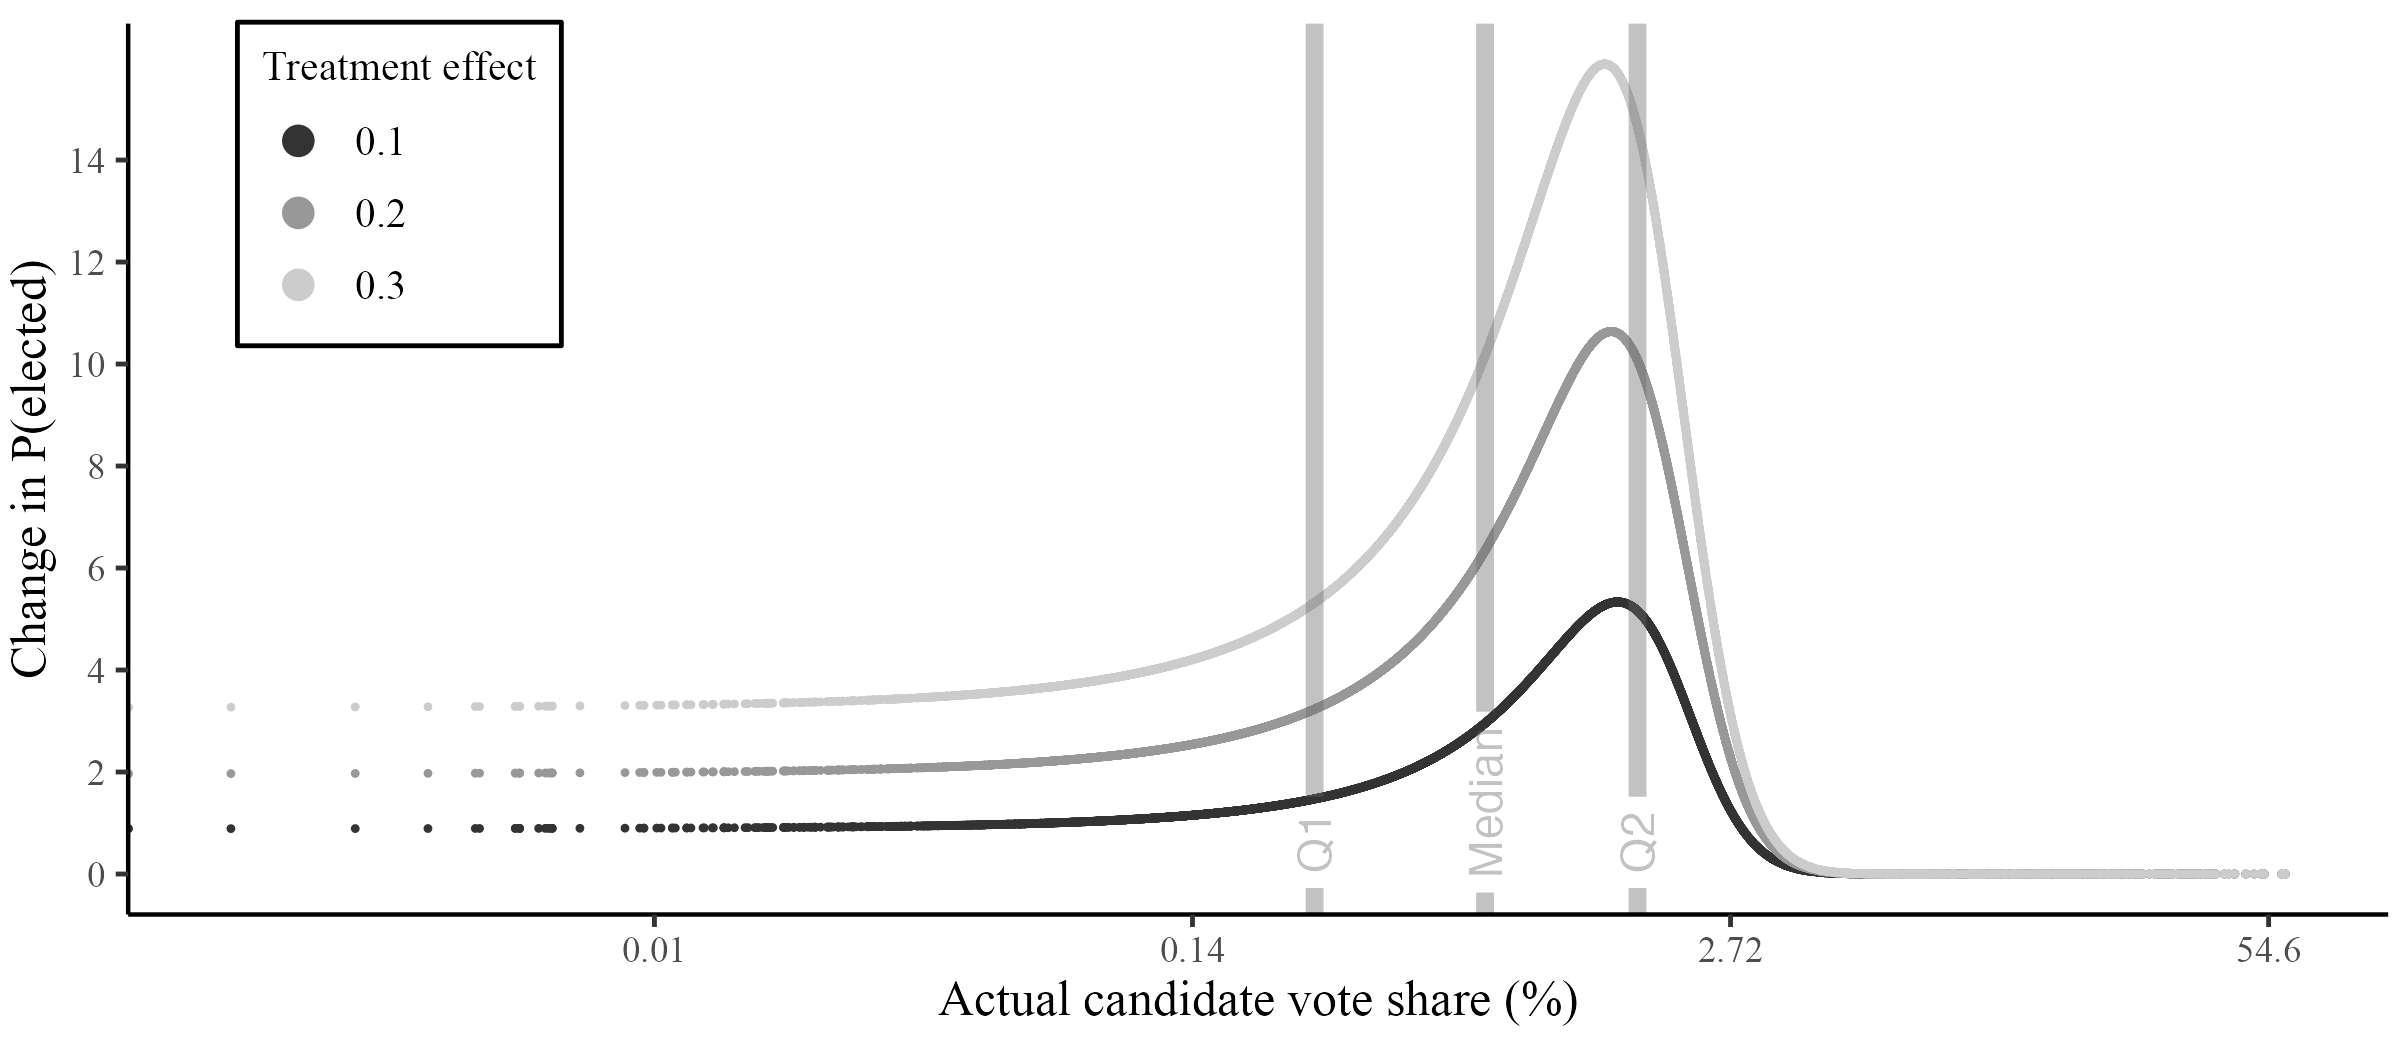
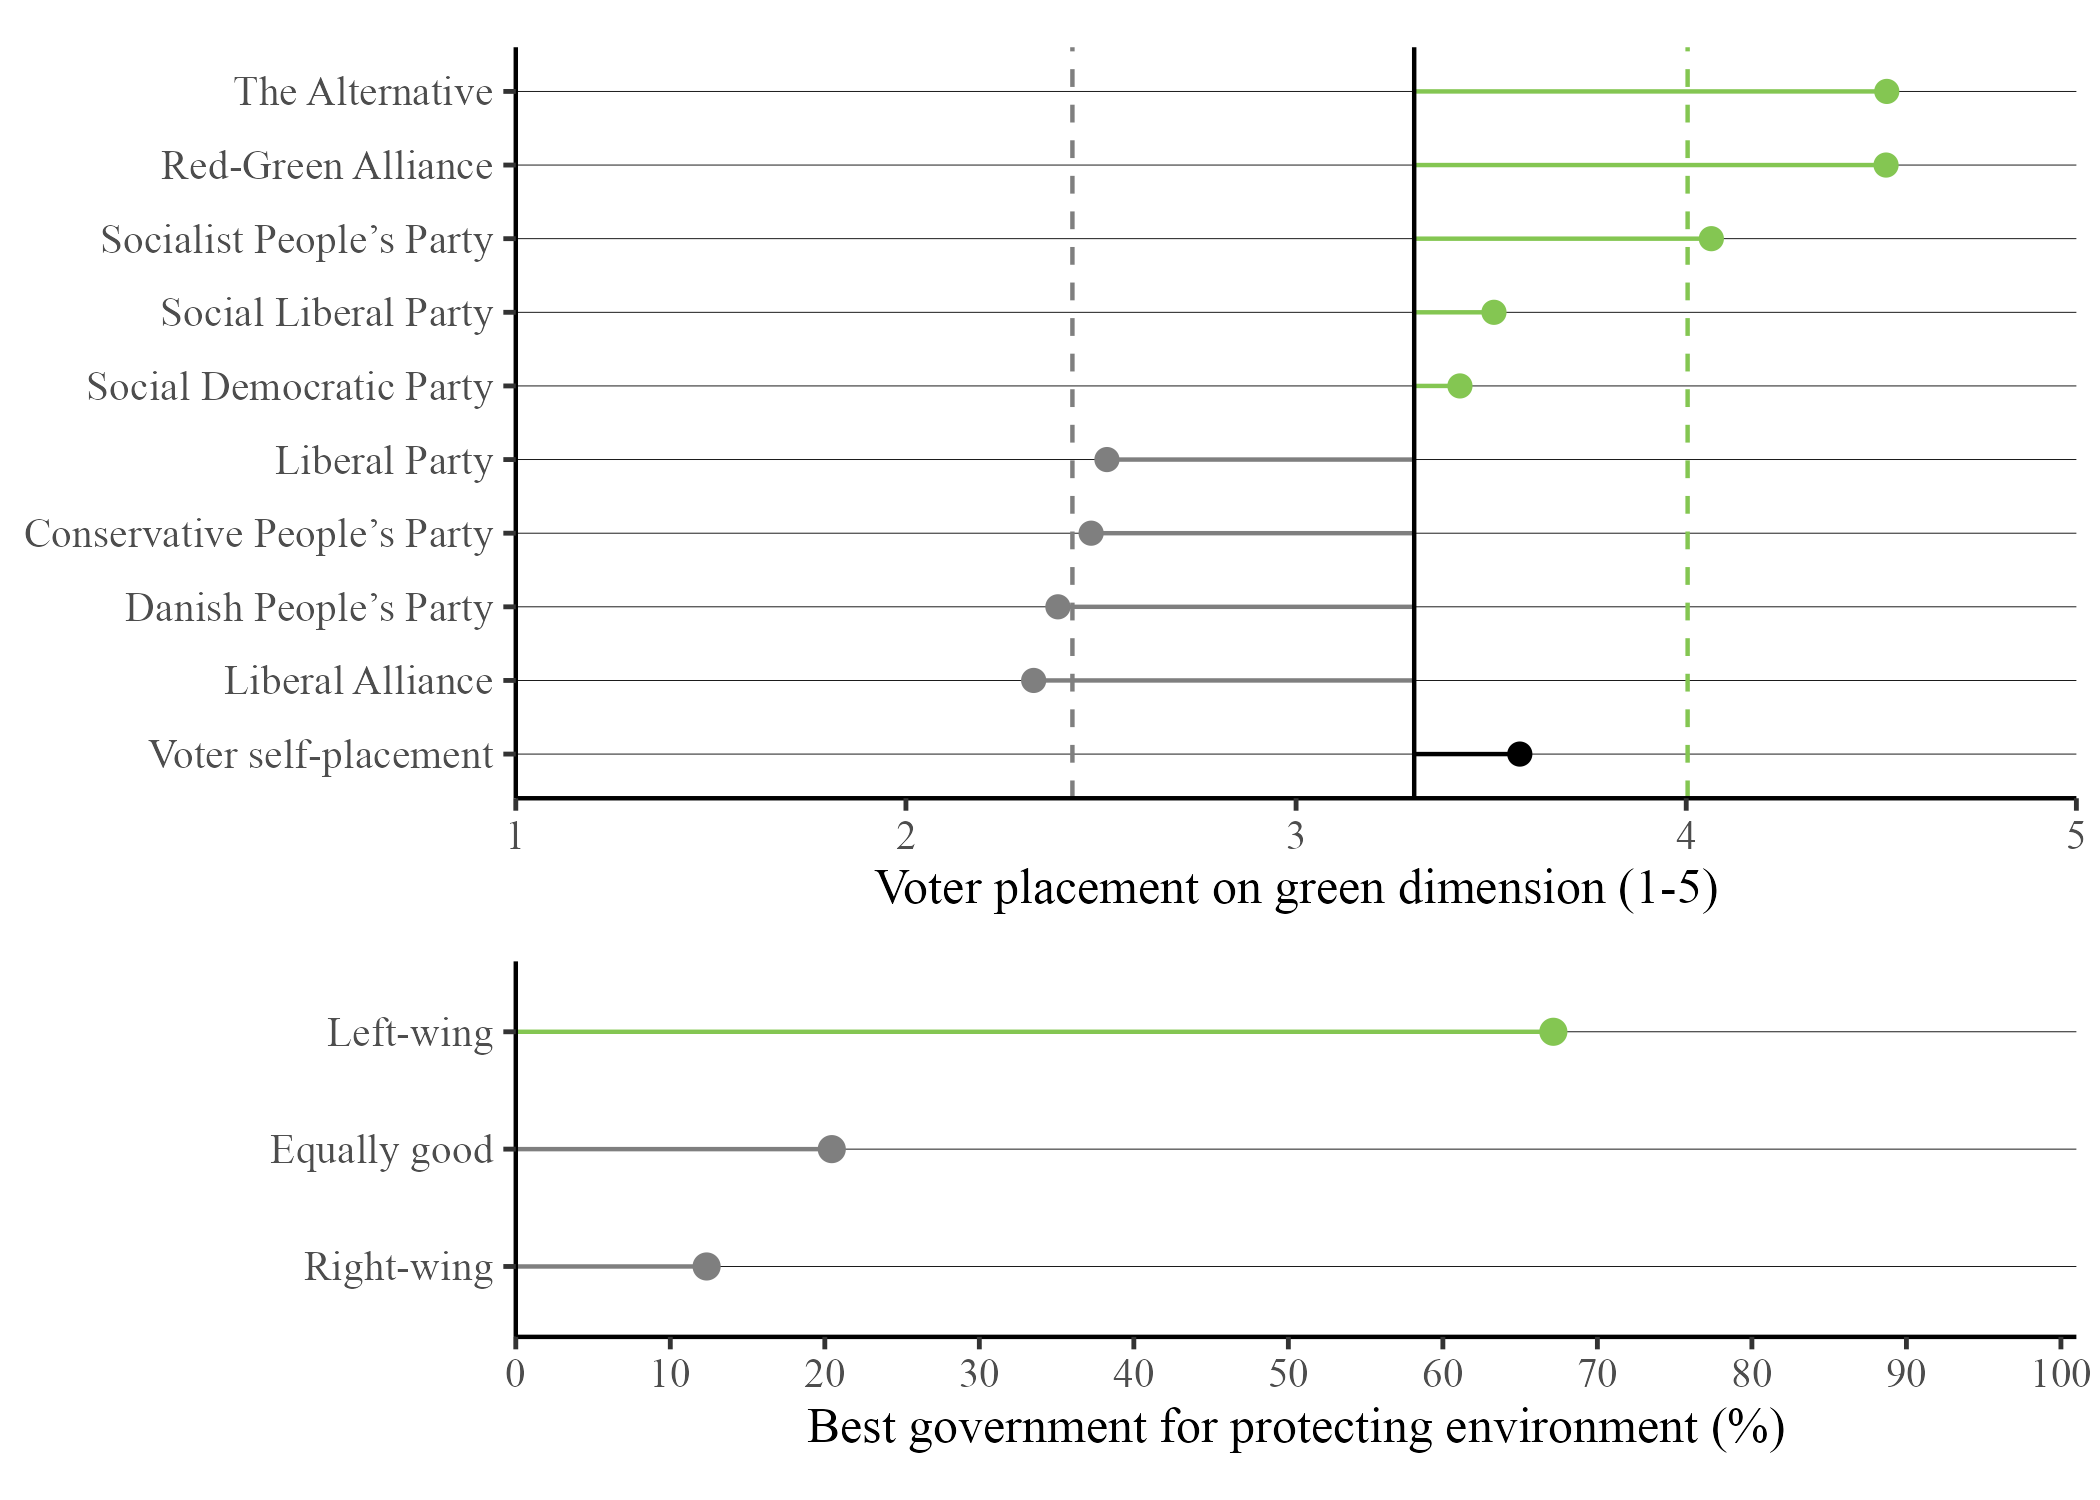
Pro-climate voting
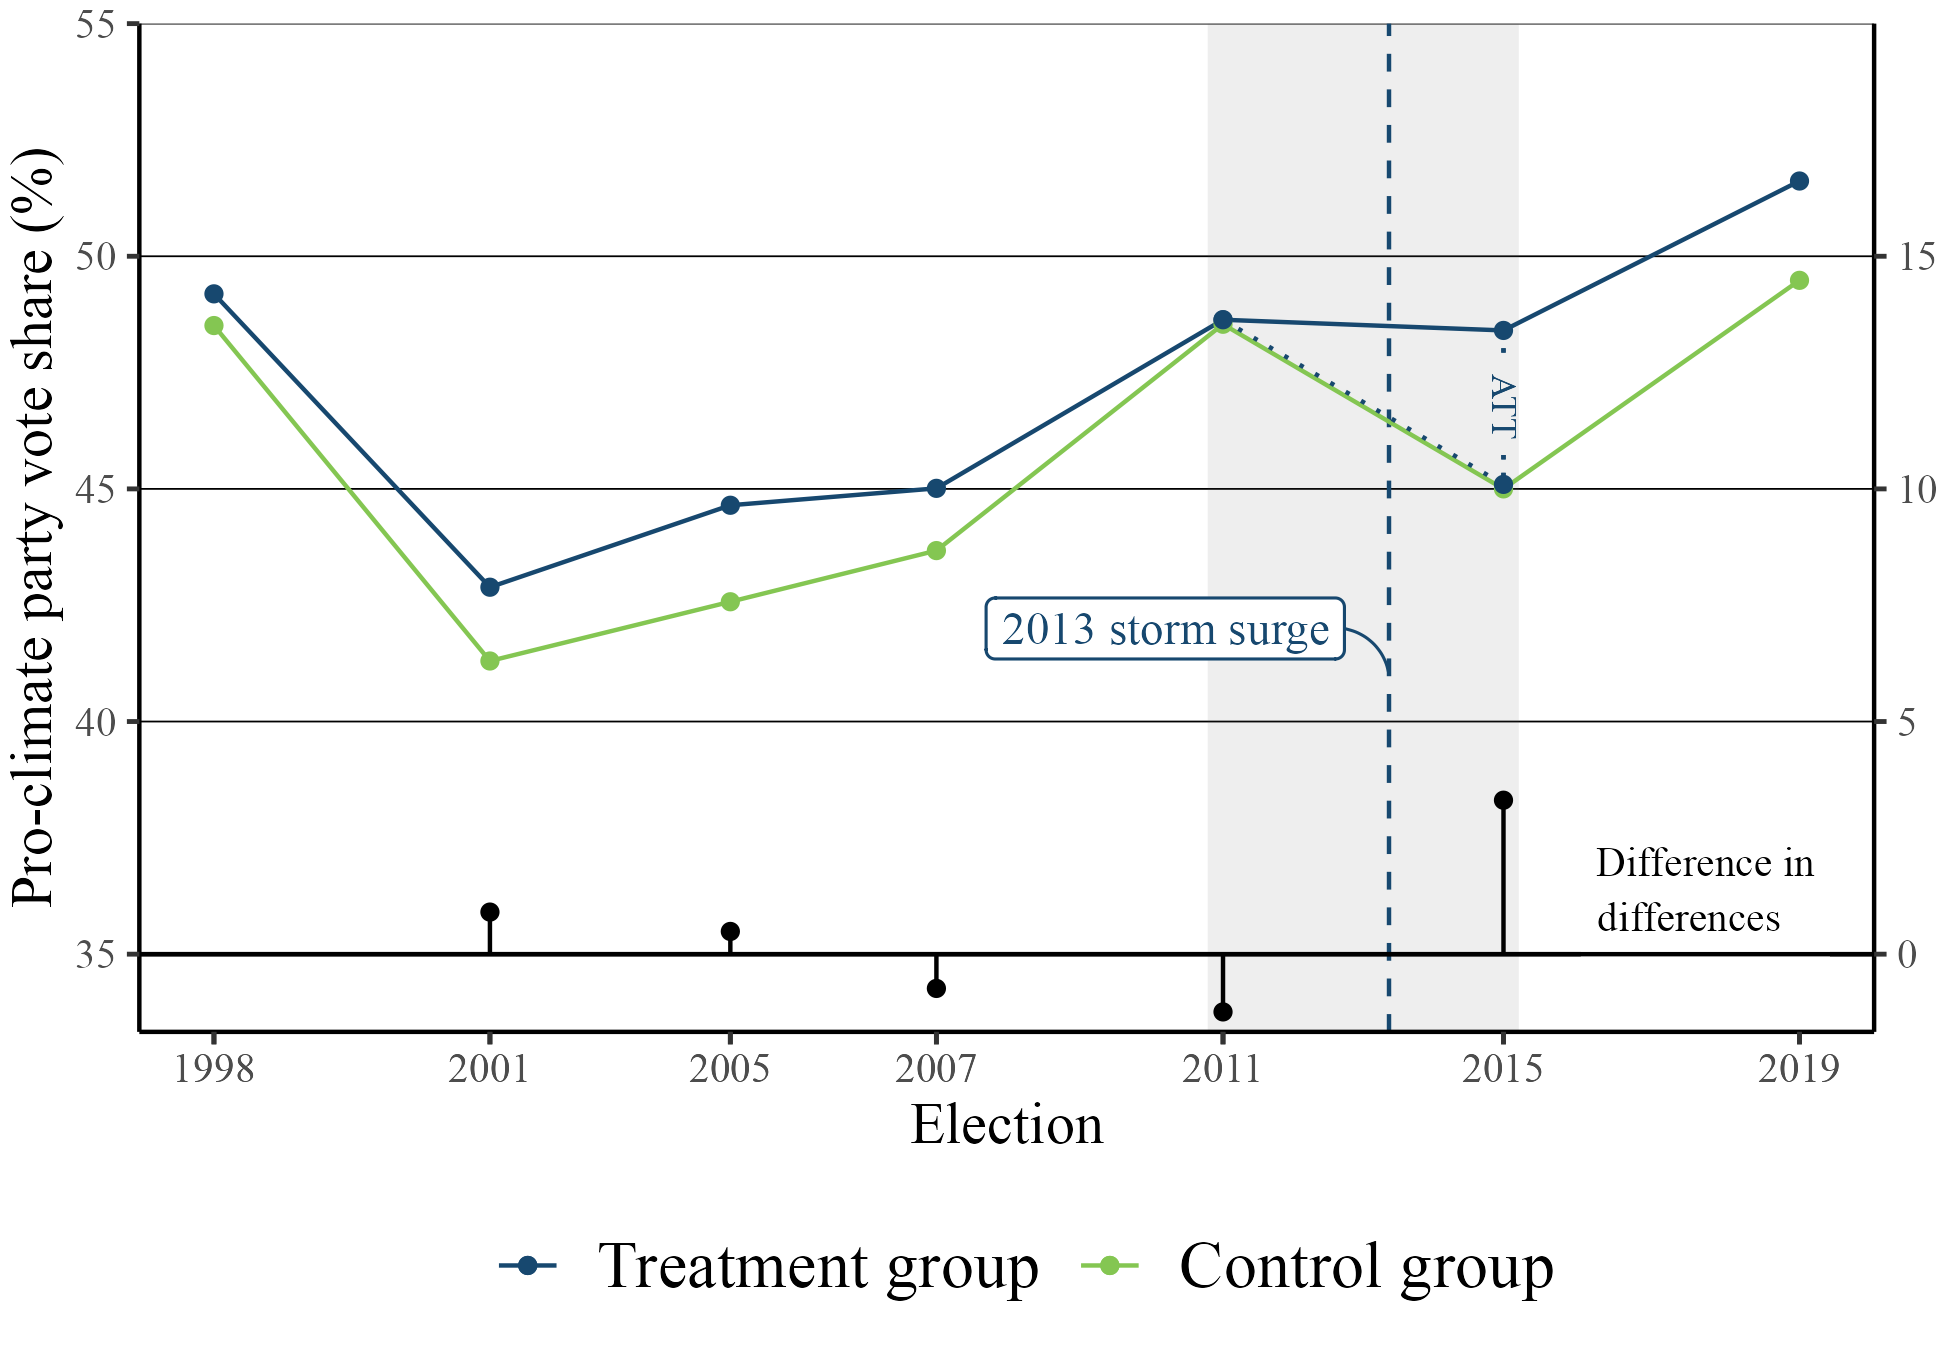
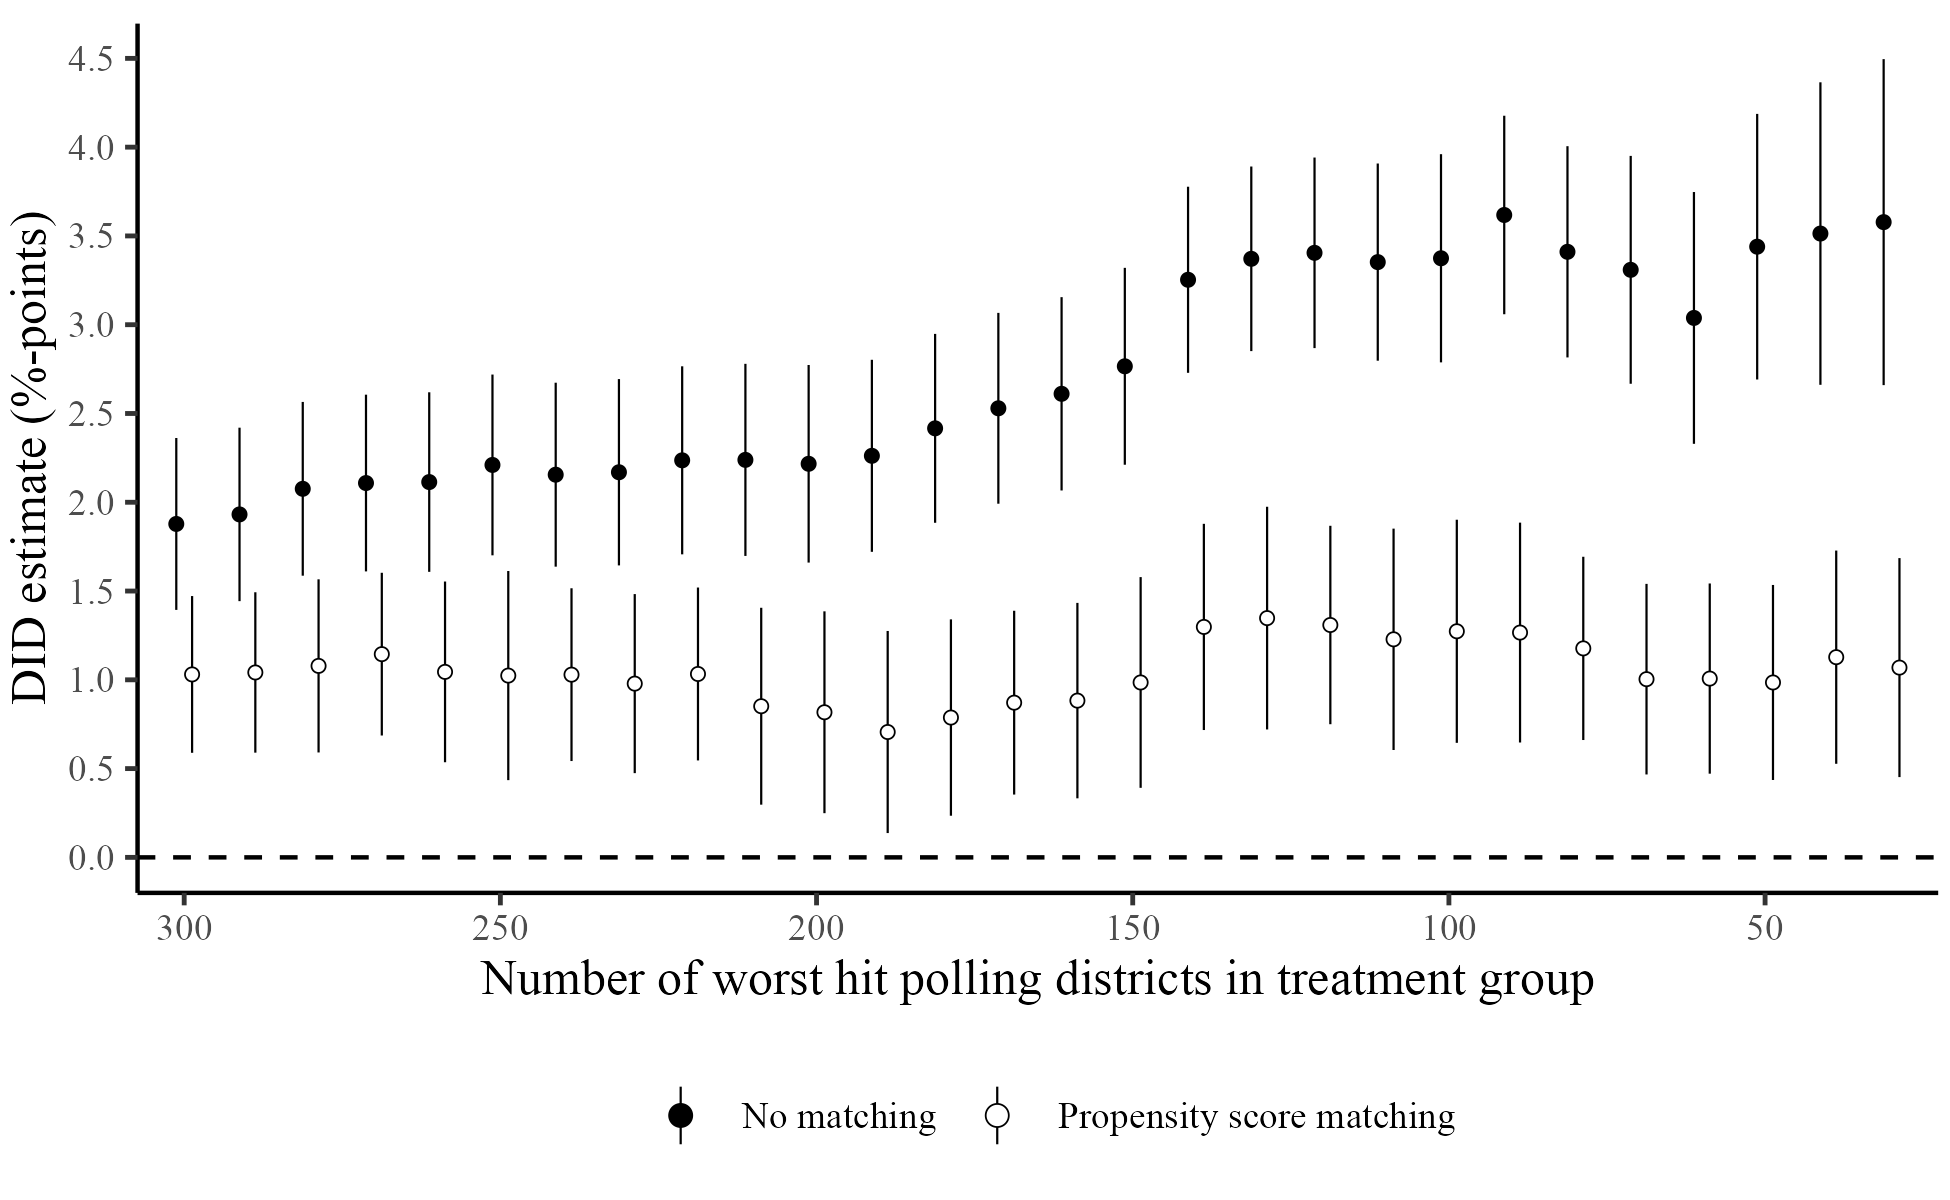
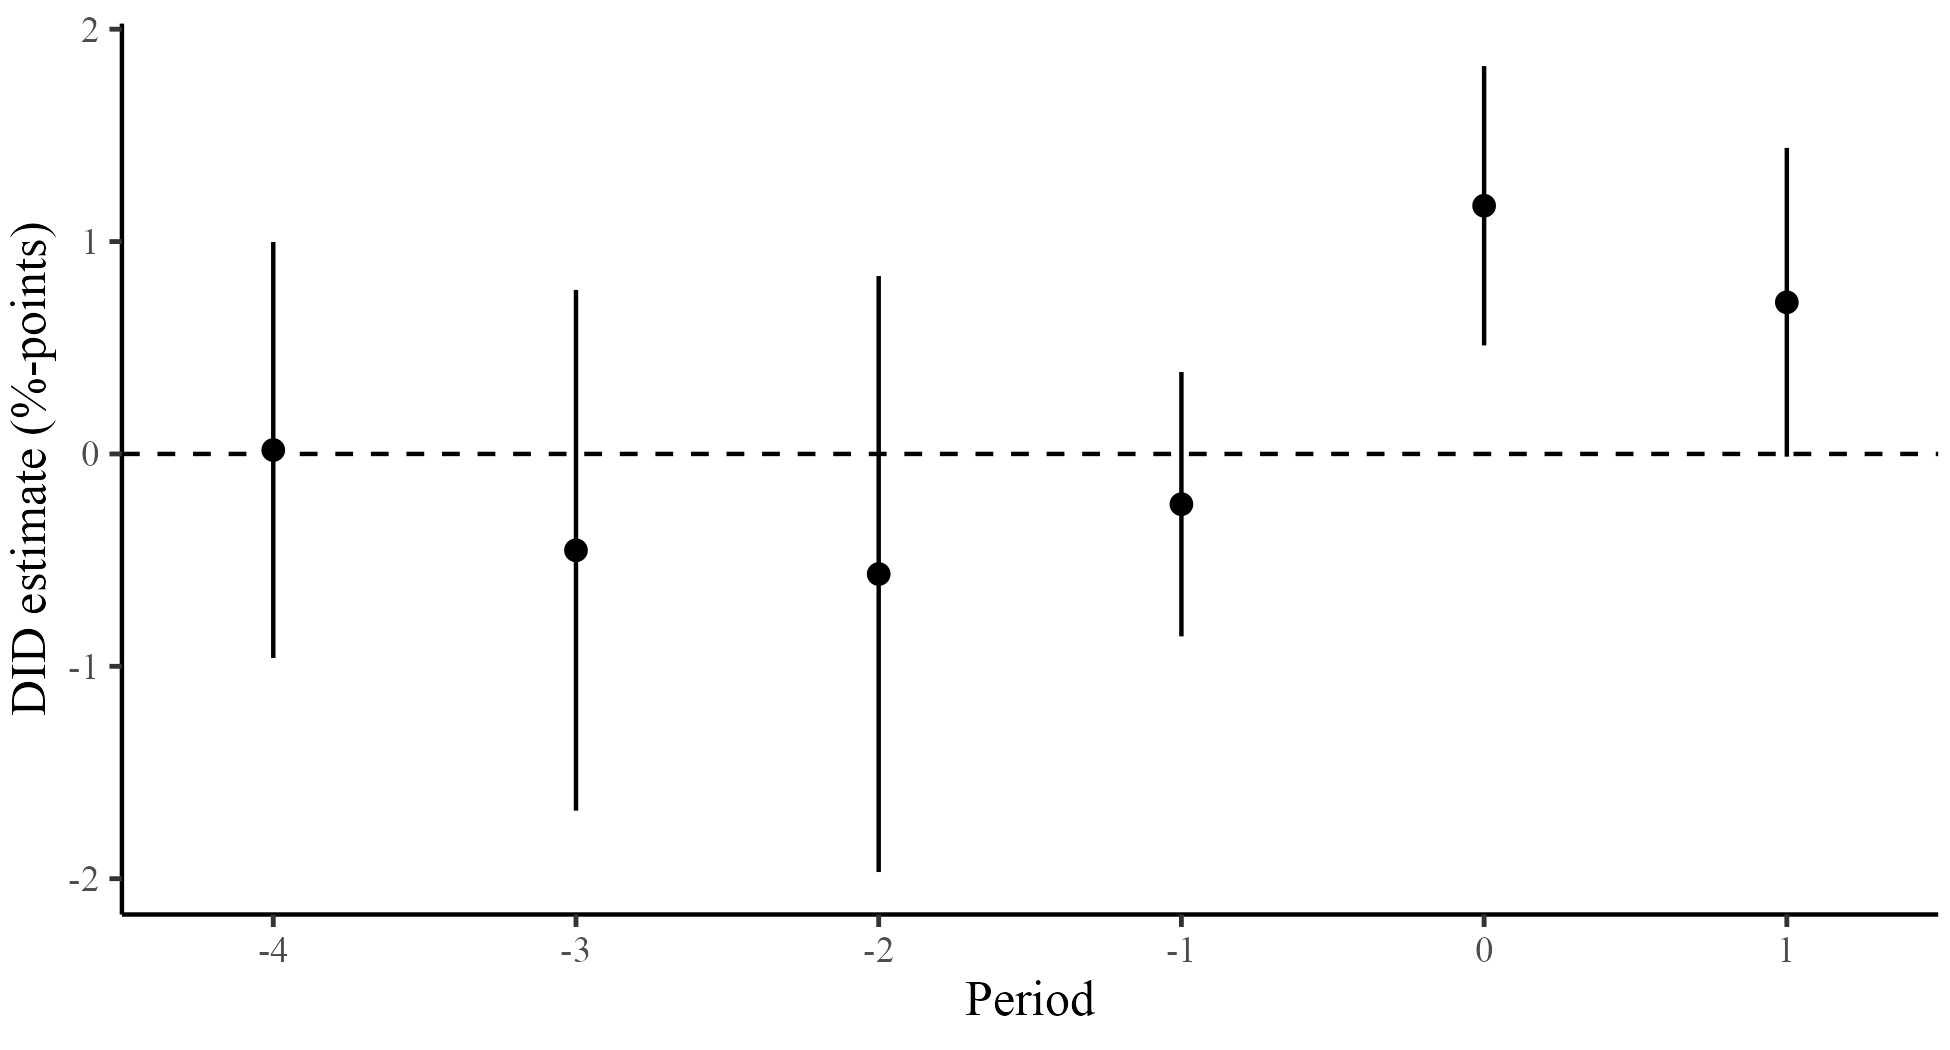
Effect estimates
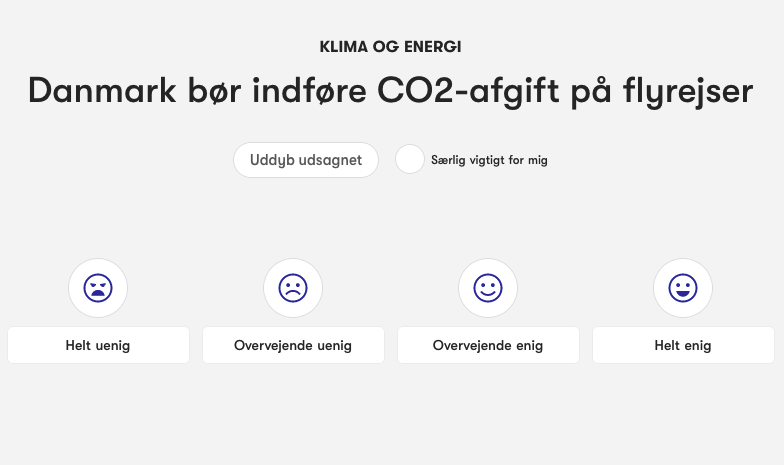
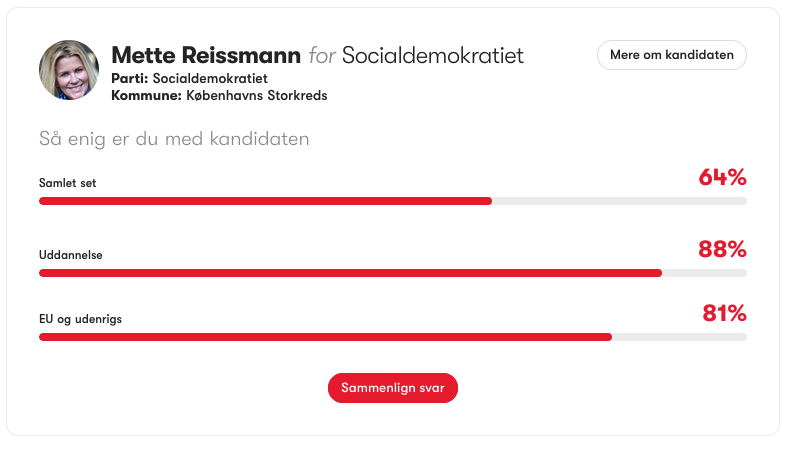
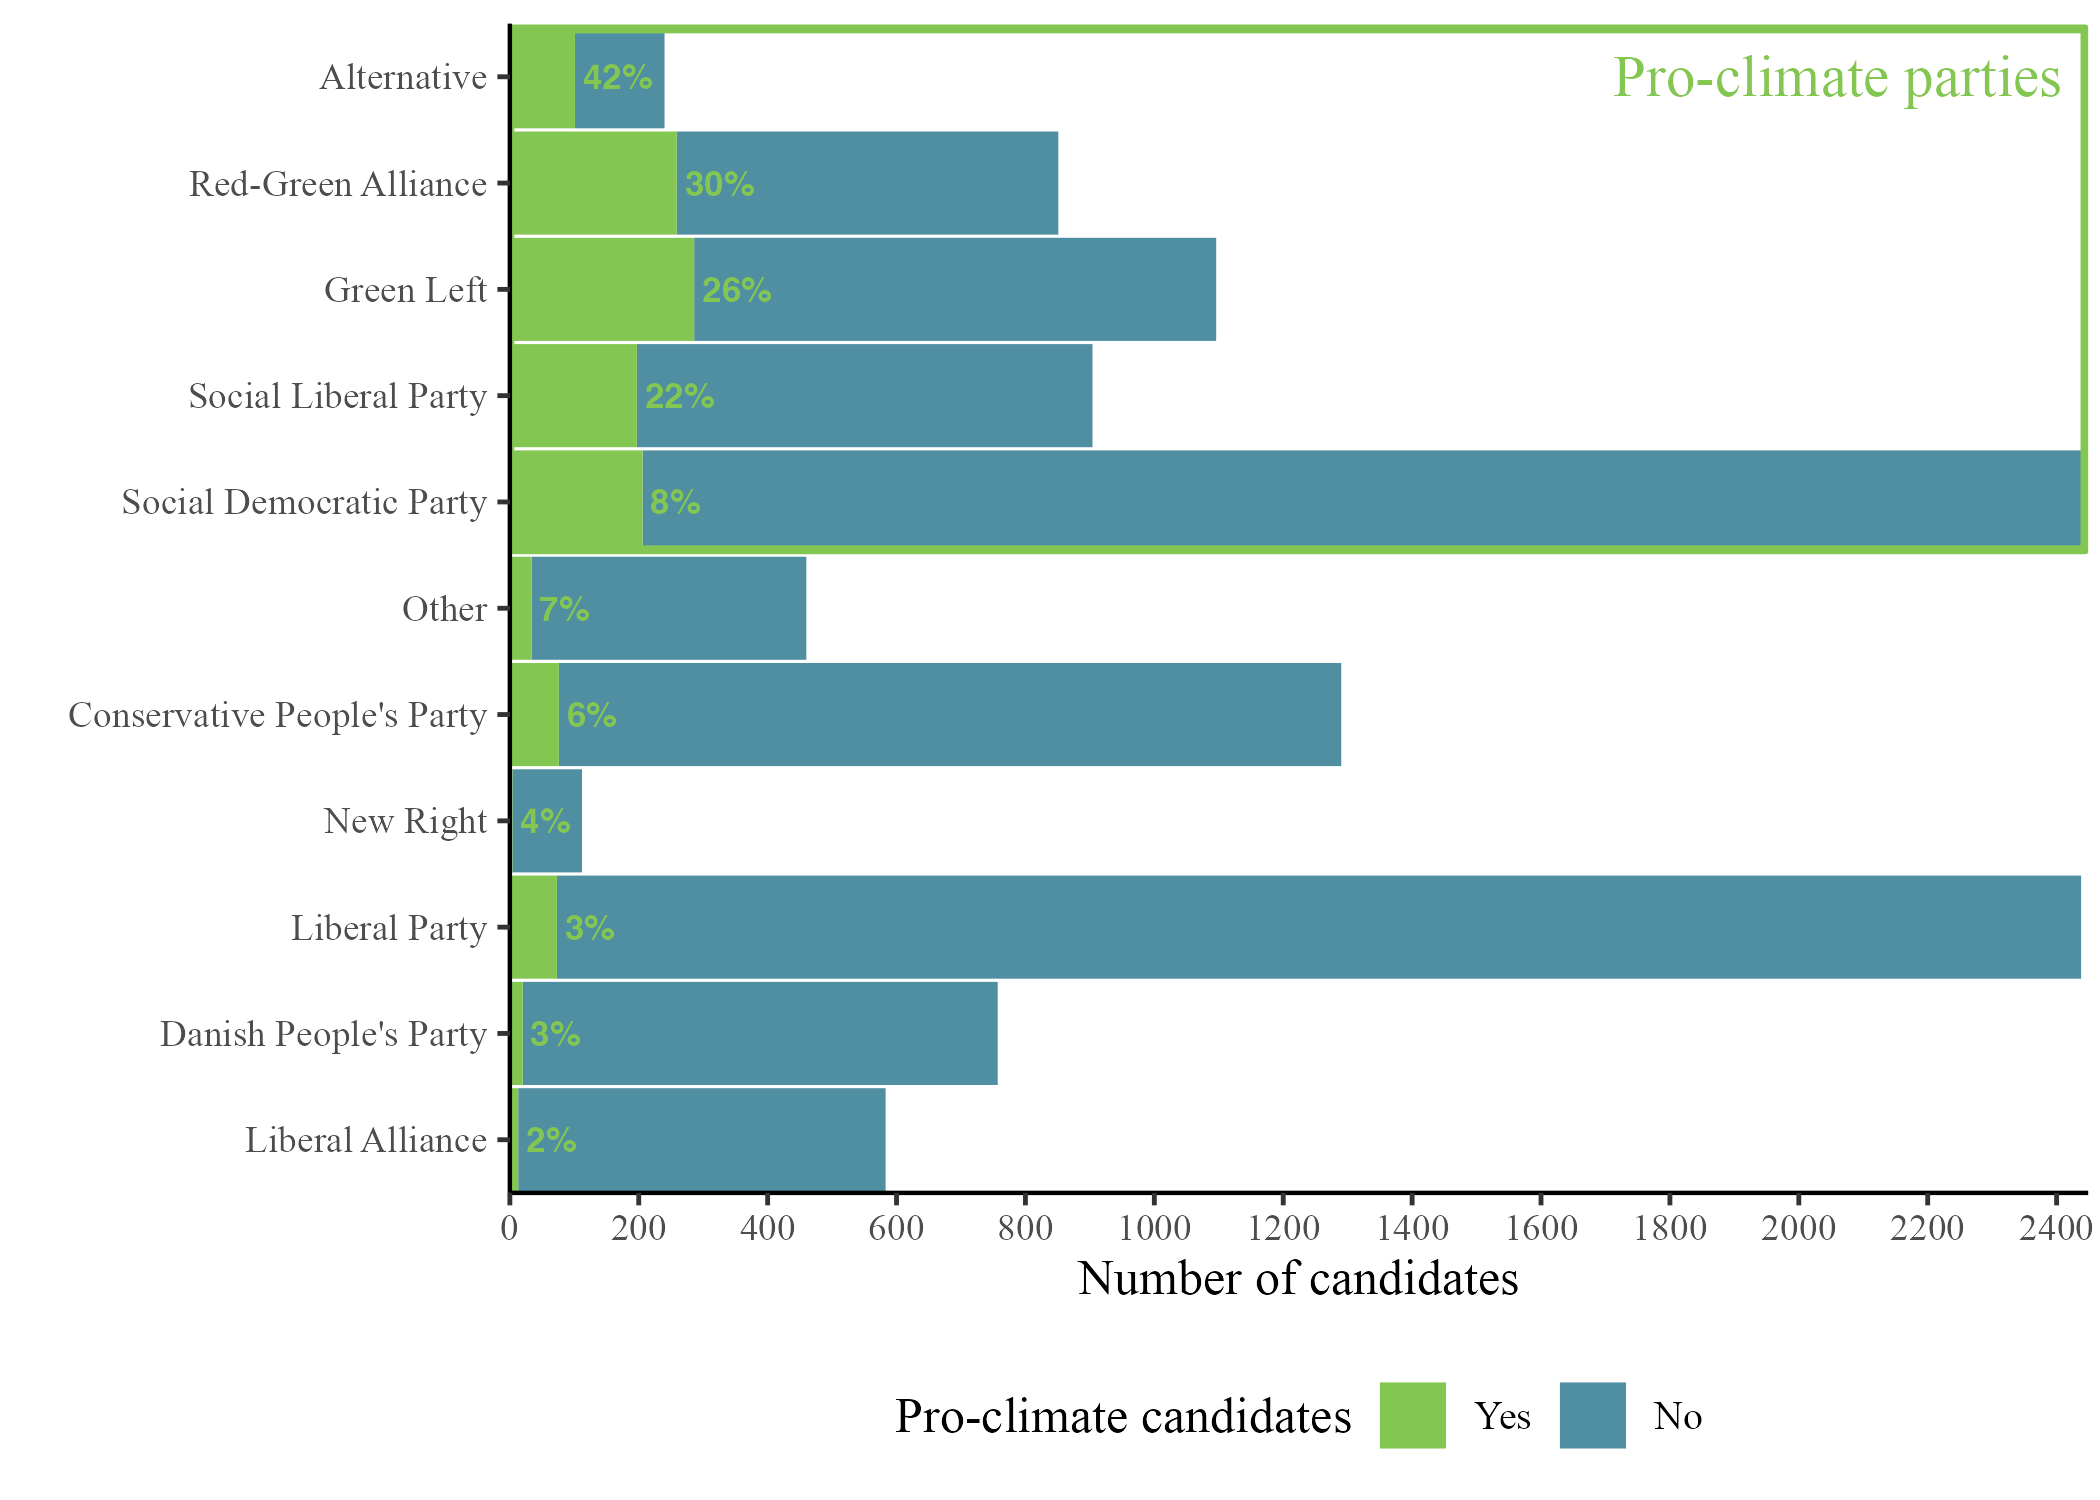
Part 2: Pro-climate candidates
- Polling advice application
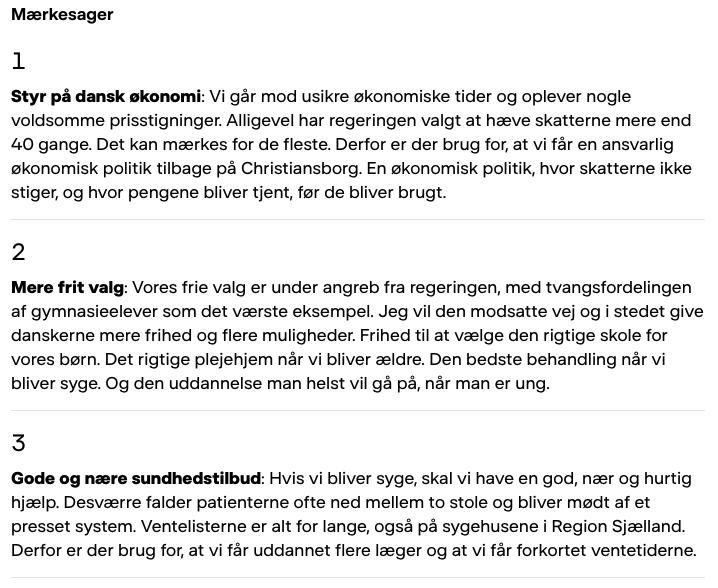
(kandidattest) - What key priorities do candidates
communicate about? - Climate-related issues?
Altinget/DR
Analysis
Results
Results
A quick summary –
Does local flooding experience lead to pro-climate voting?
- Yes – parties and candidates
- Several %-points
- Climate-related issues become salient
- Salience translated into pro-climate vote using parties’ reputation and candidates’ communication
<Supplementary material in Section 10>
Article 4: Turnout
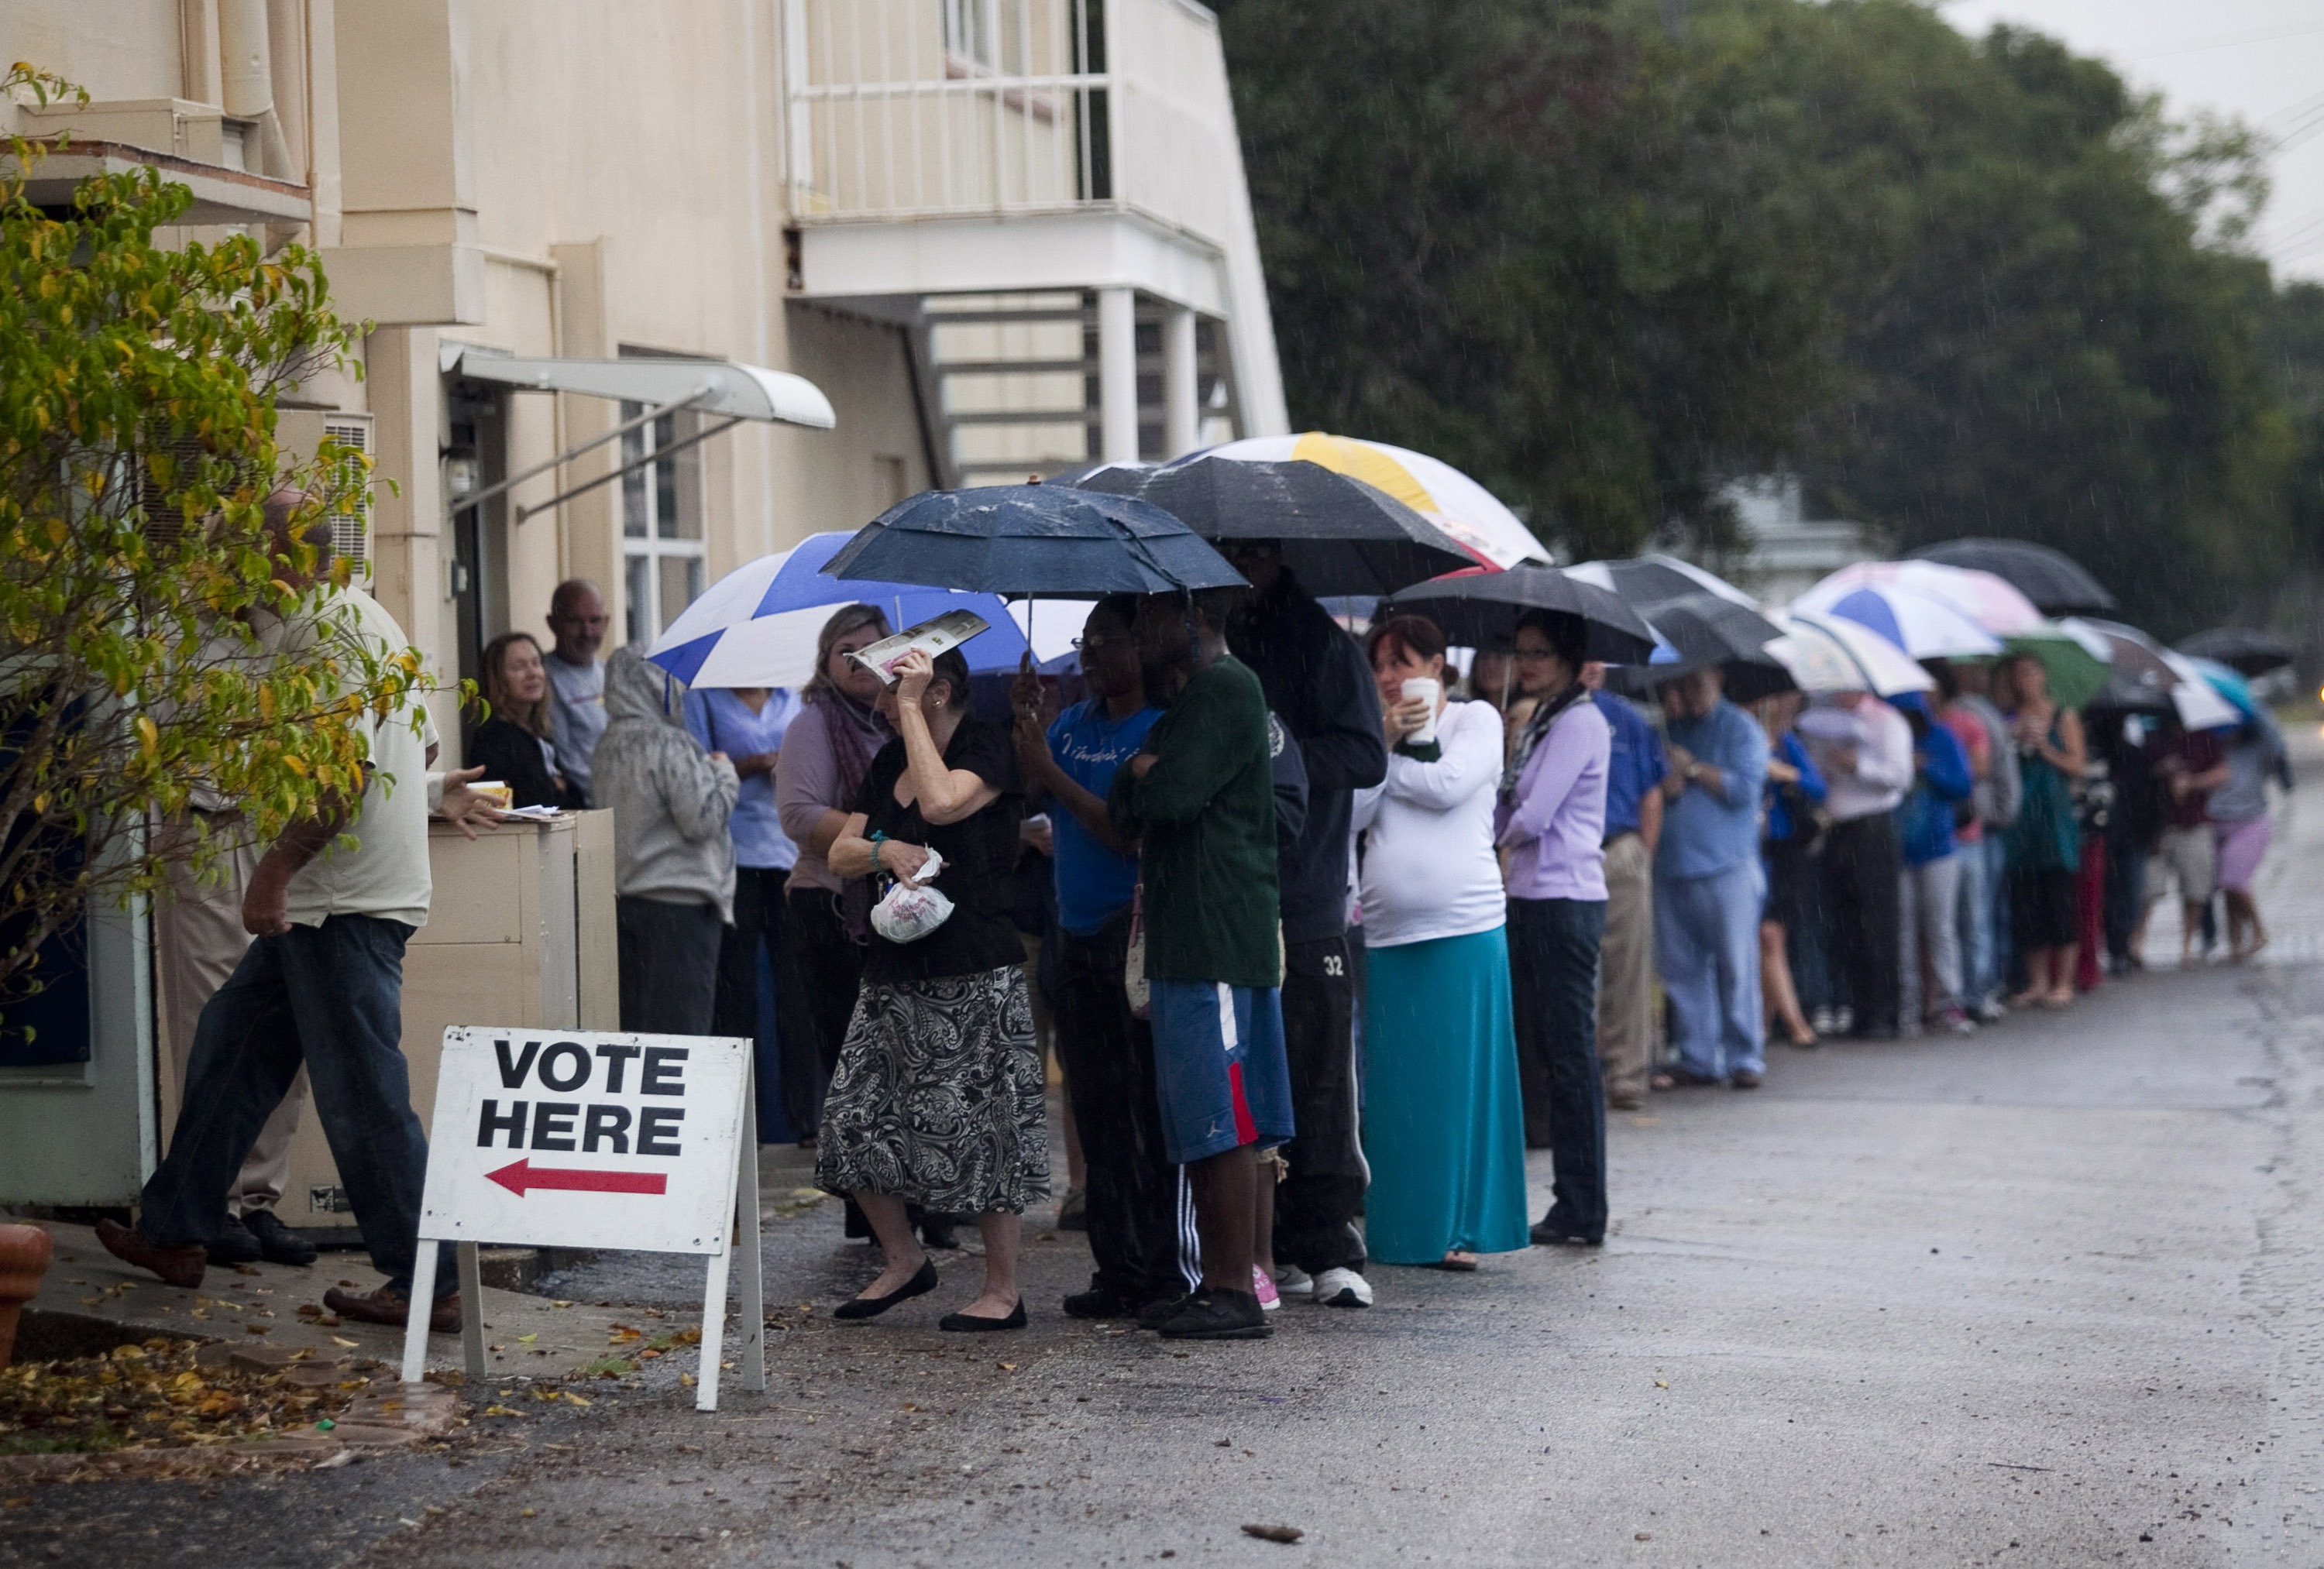
- “When the election rains out and how bad weather
excludes marginal voters from turning out” - Published in Electoral Studies (2023)
- Co-authored with Kasper M. Hansen
How does the weather affect electoral turnout?
(prev. slide) Edward Linsmier/AFP
Rainfall and turnout
Election Day weather
- Turnout around 70%
(2013: 72%, 2017: 71%) - 30% don’t vote
- What role does the weather play?
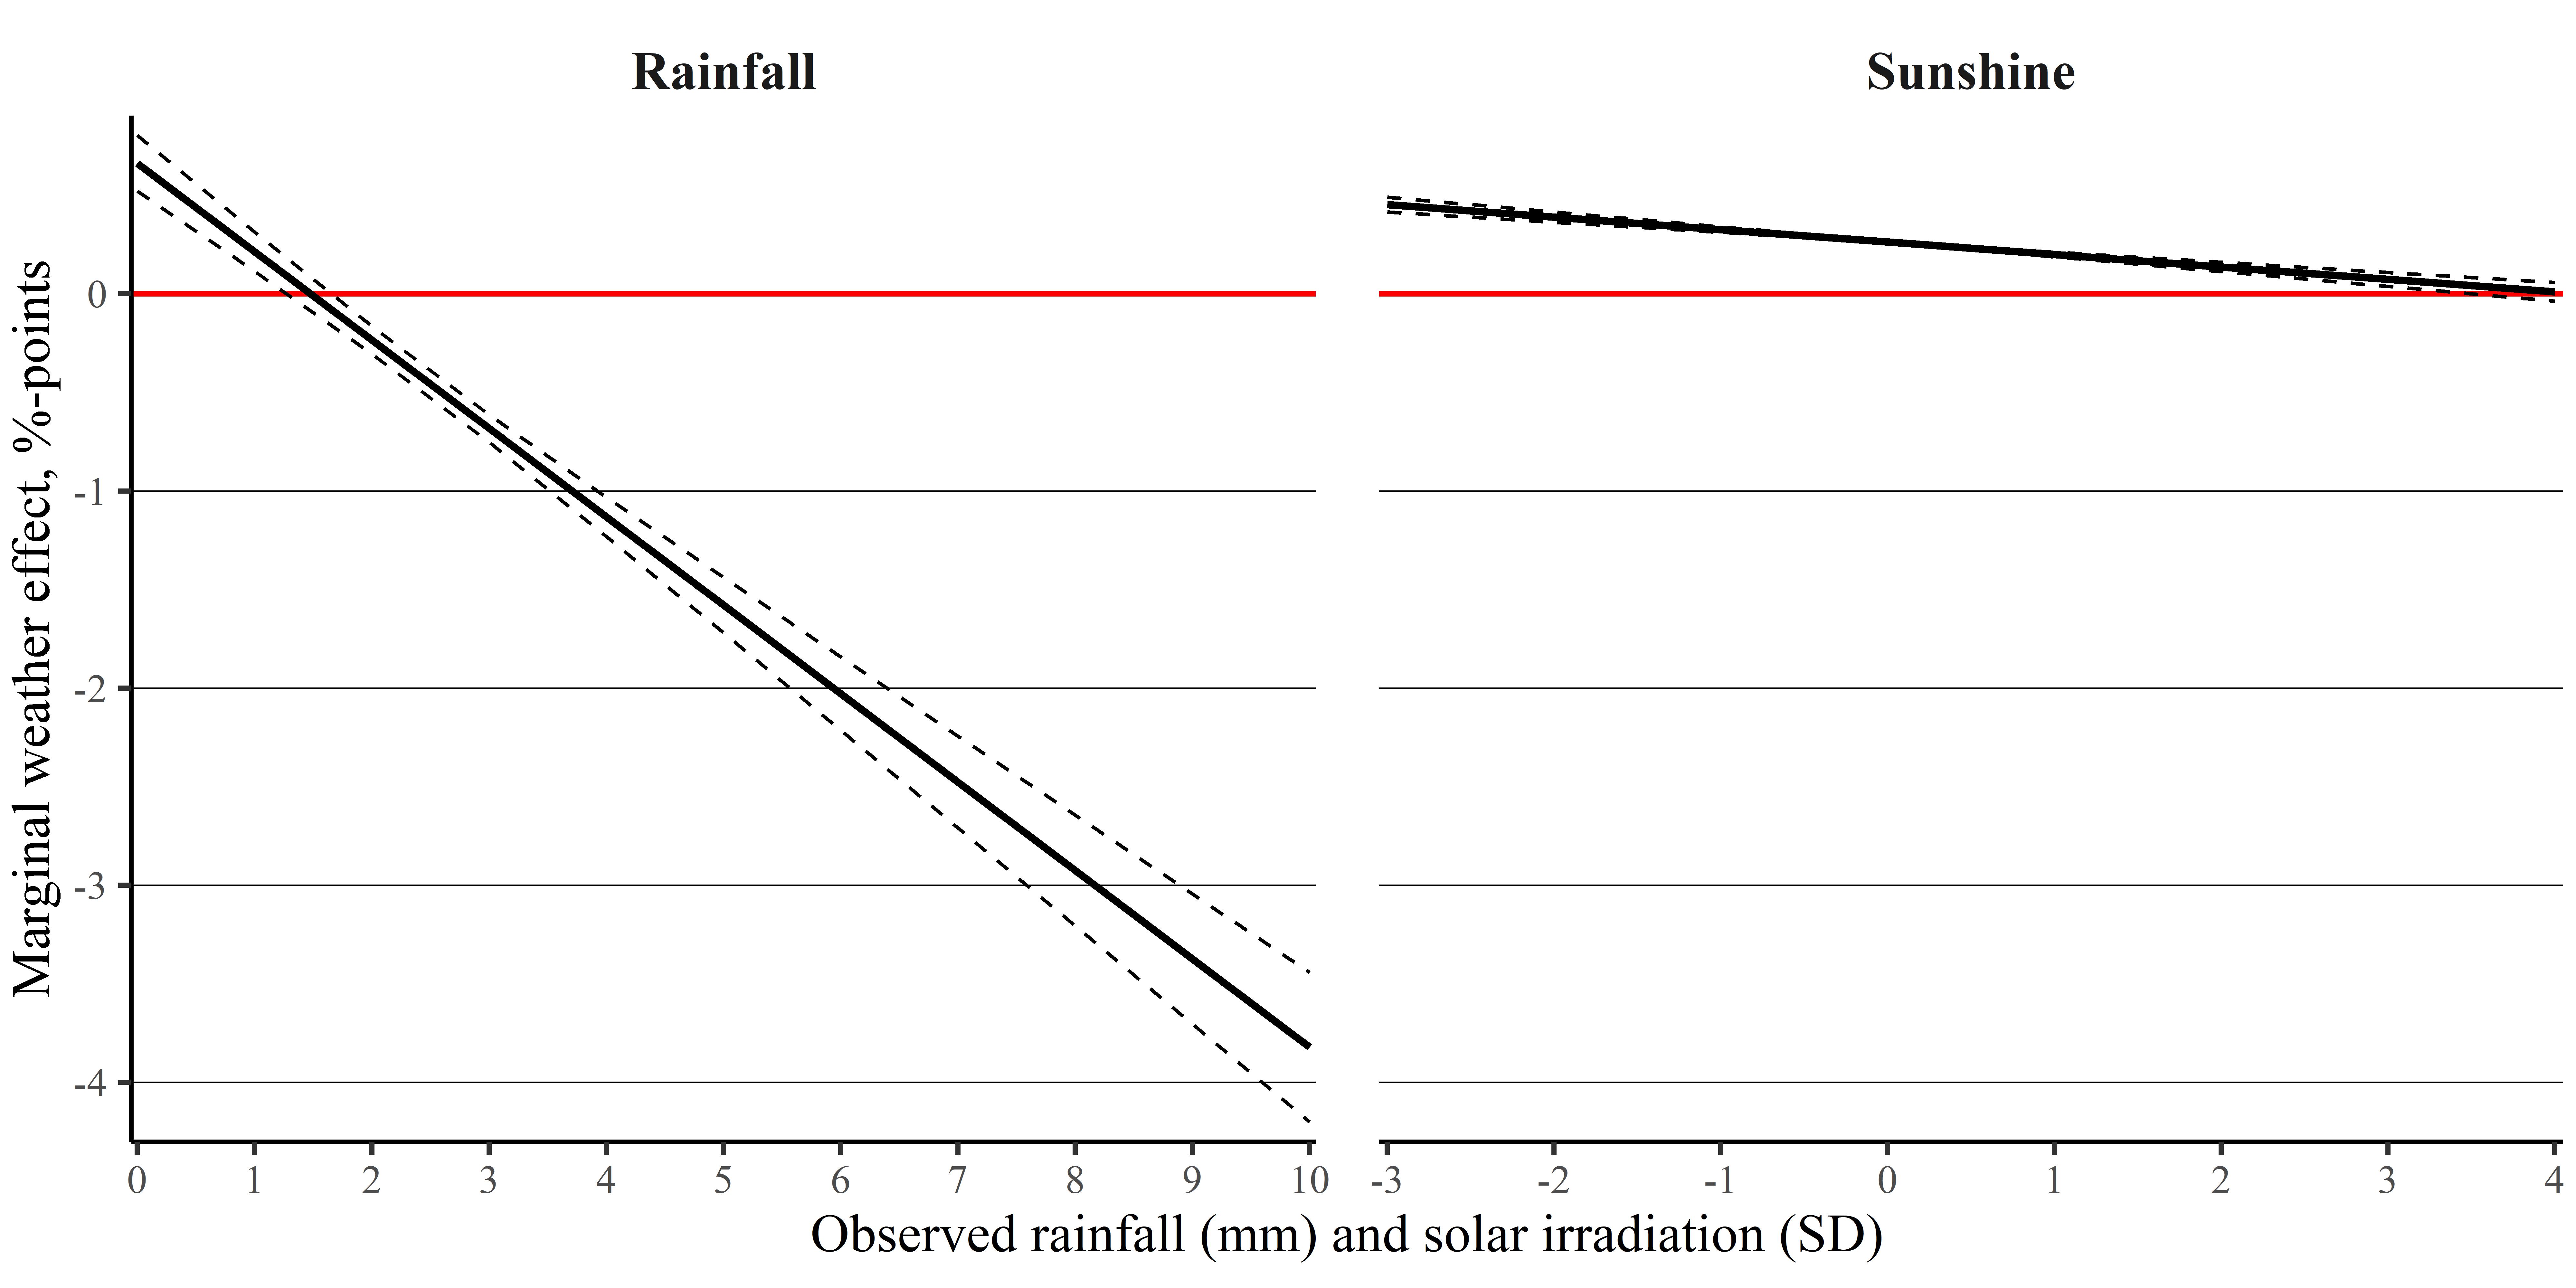
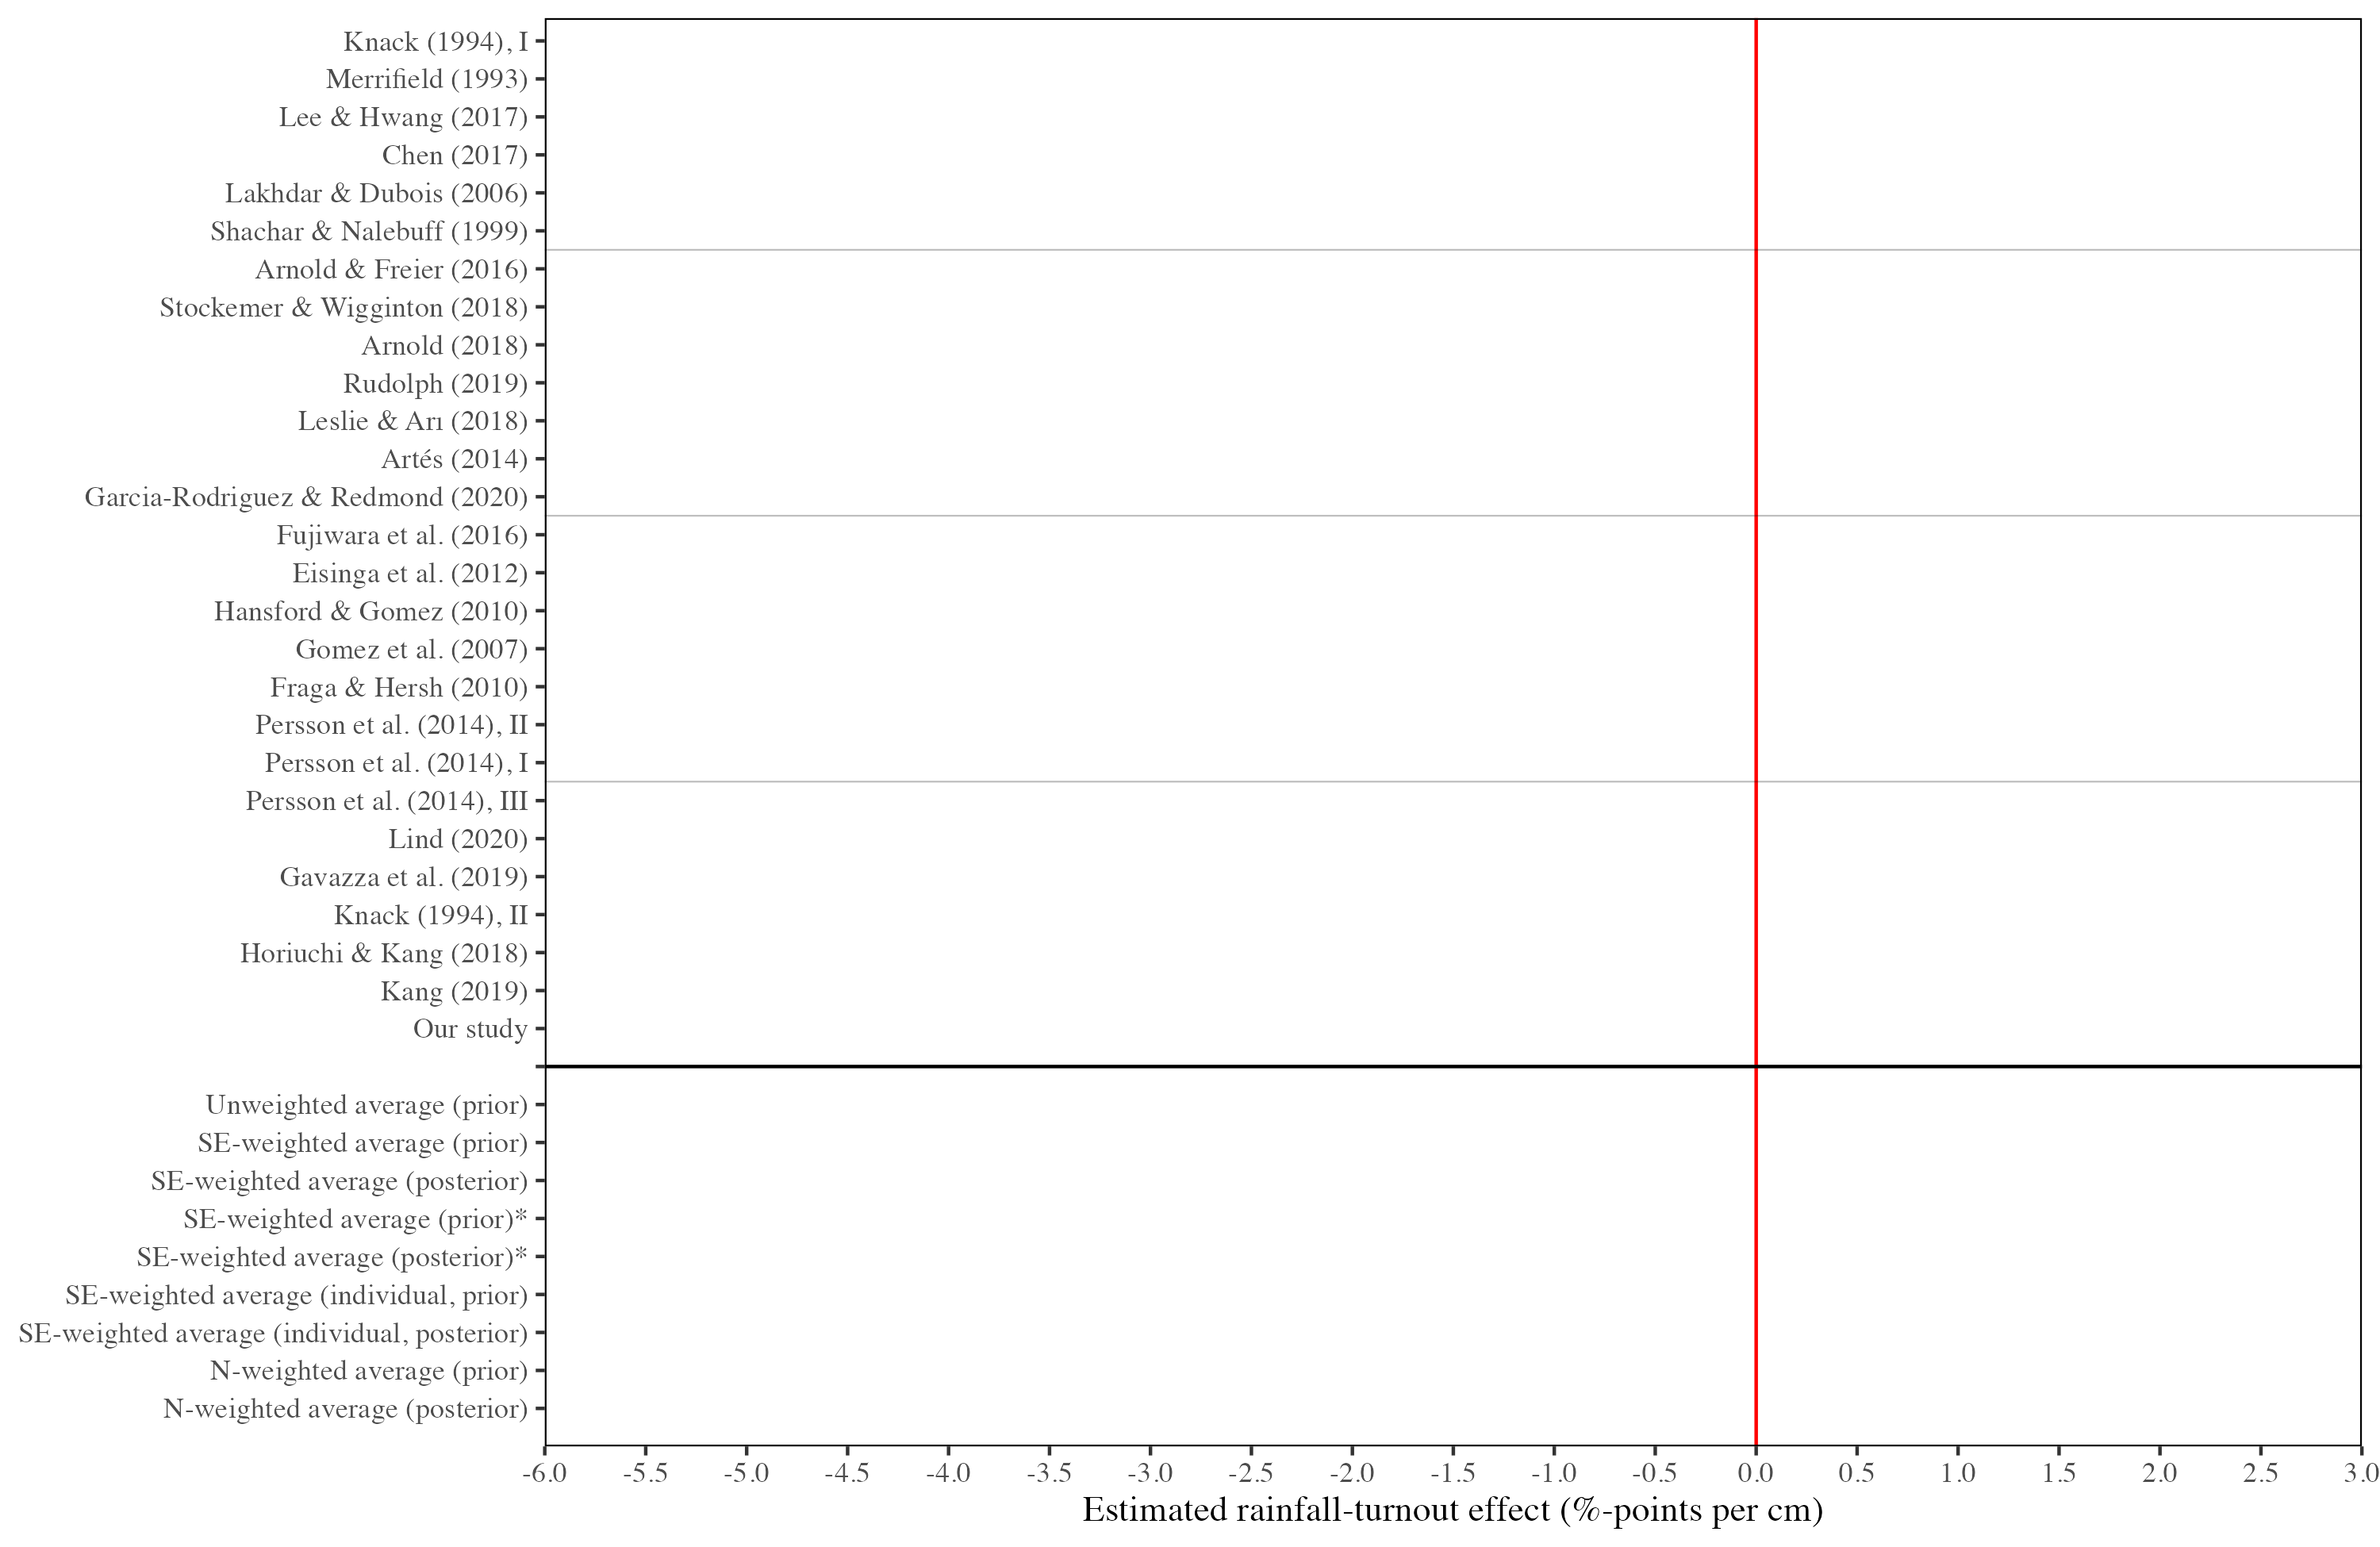
Results
- Rainfall reduces P(voting) by almost 1 %-points per cm
Results
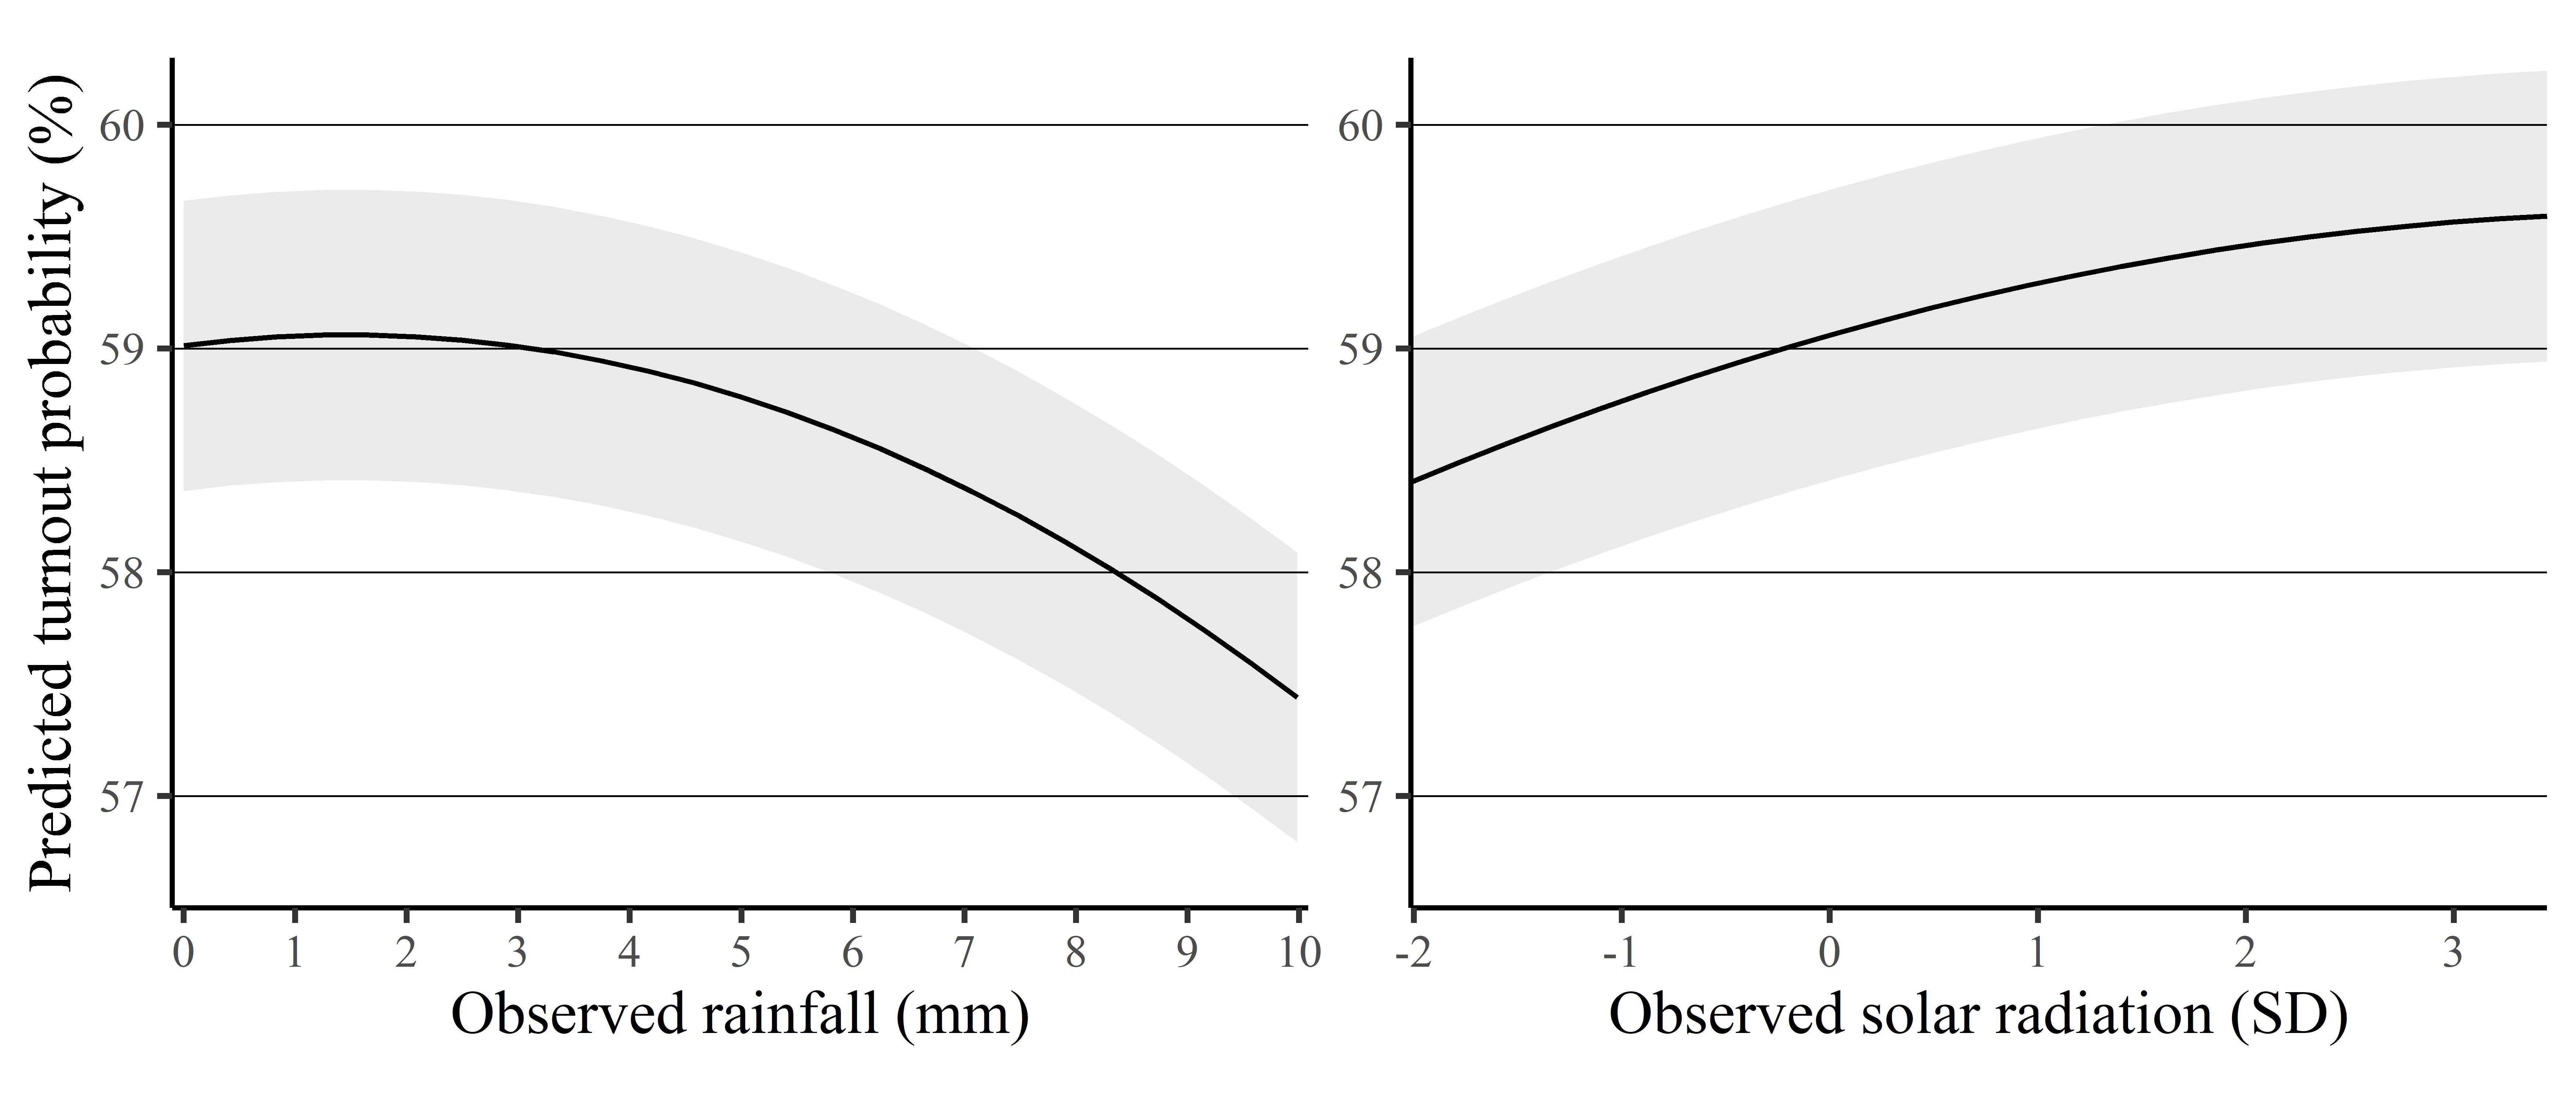
- Rainfall effect grows with more rainfall
- Sunshine increases turnout
Who is susceptible to bad weather?
![]()
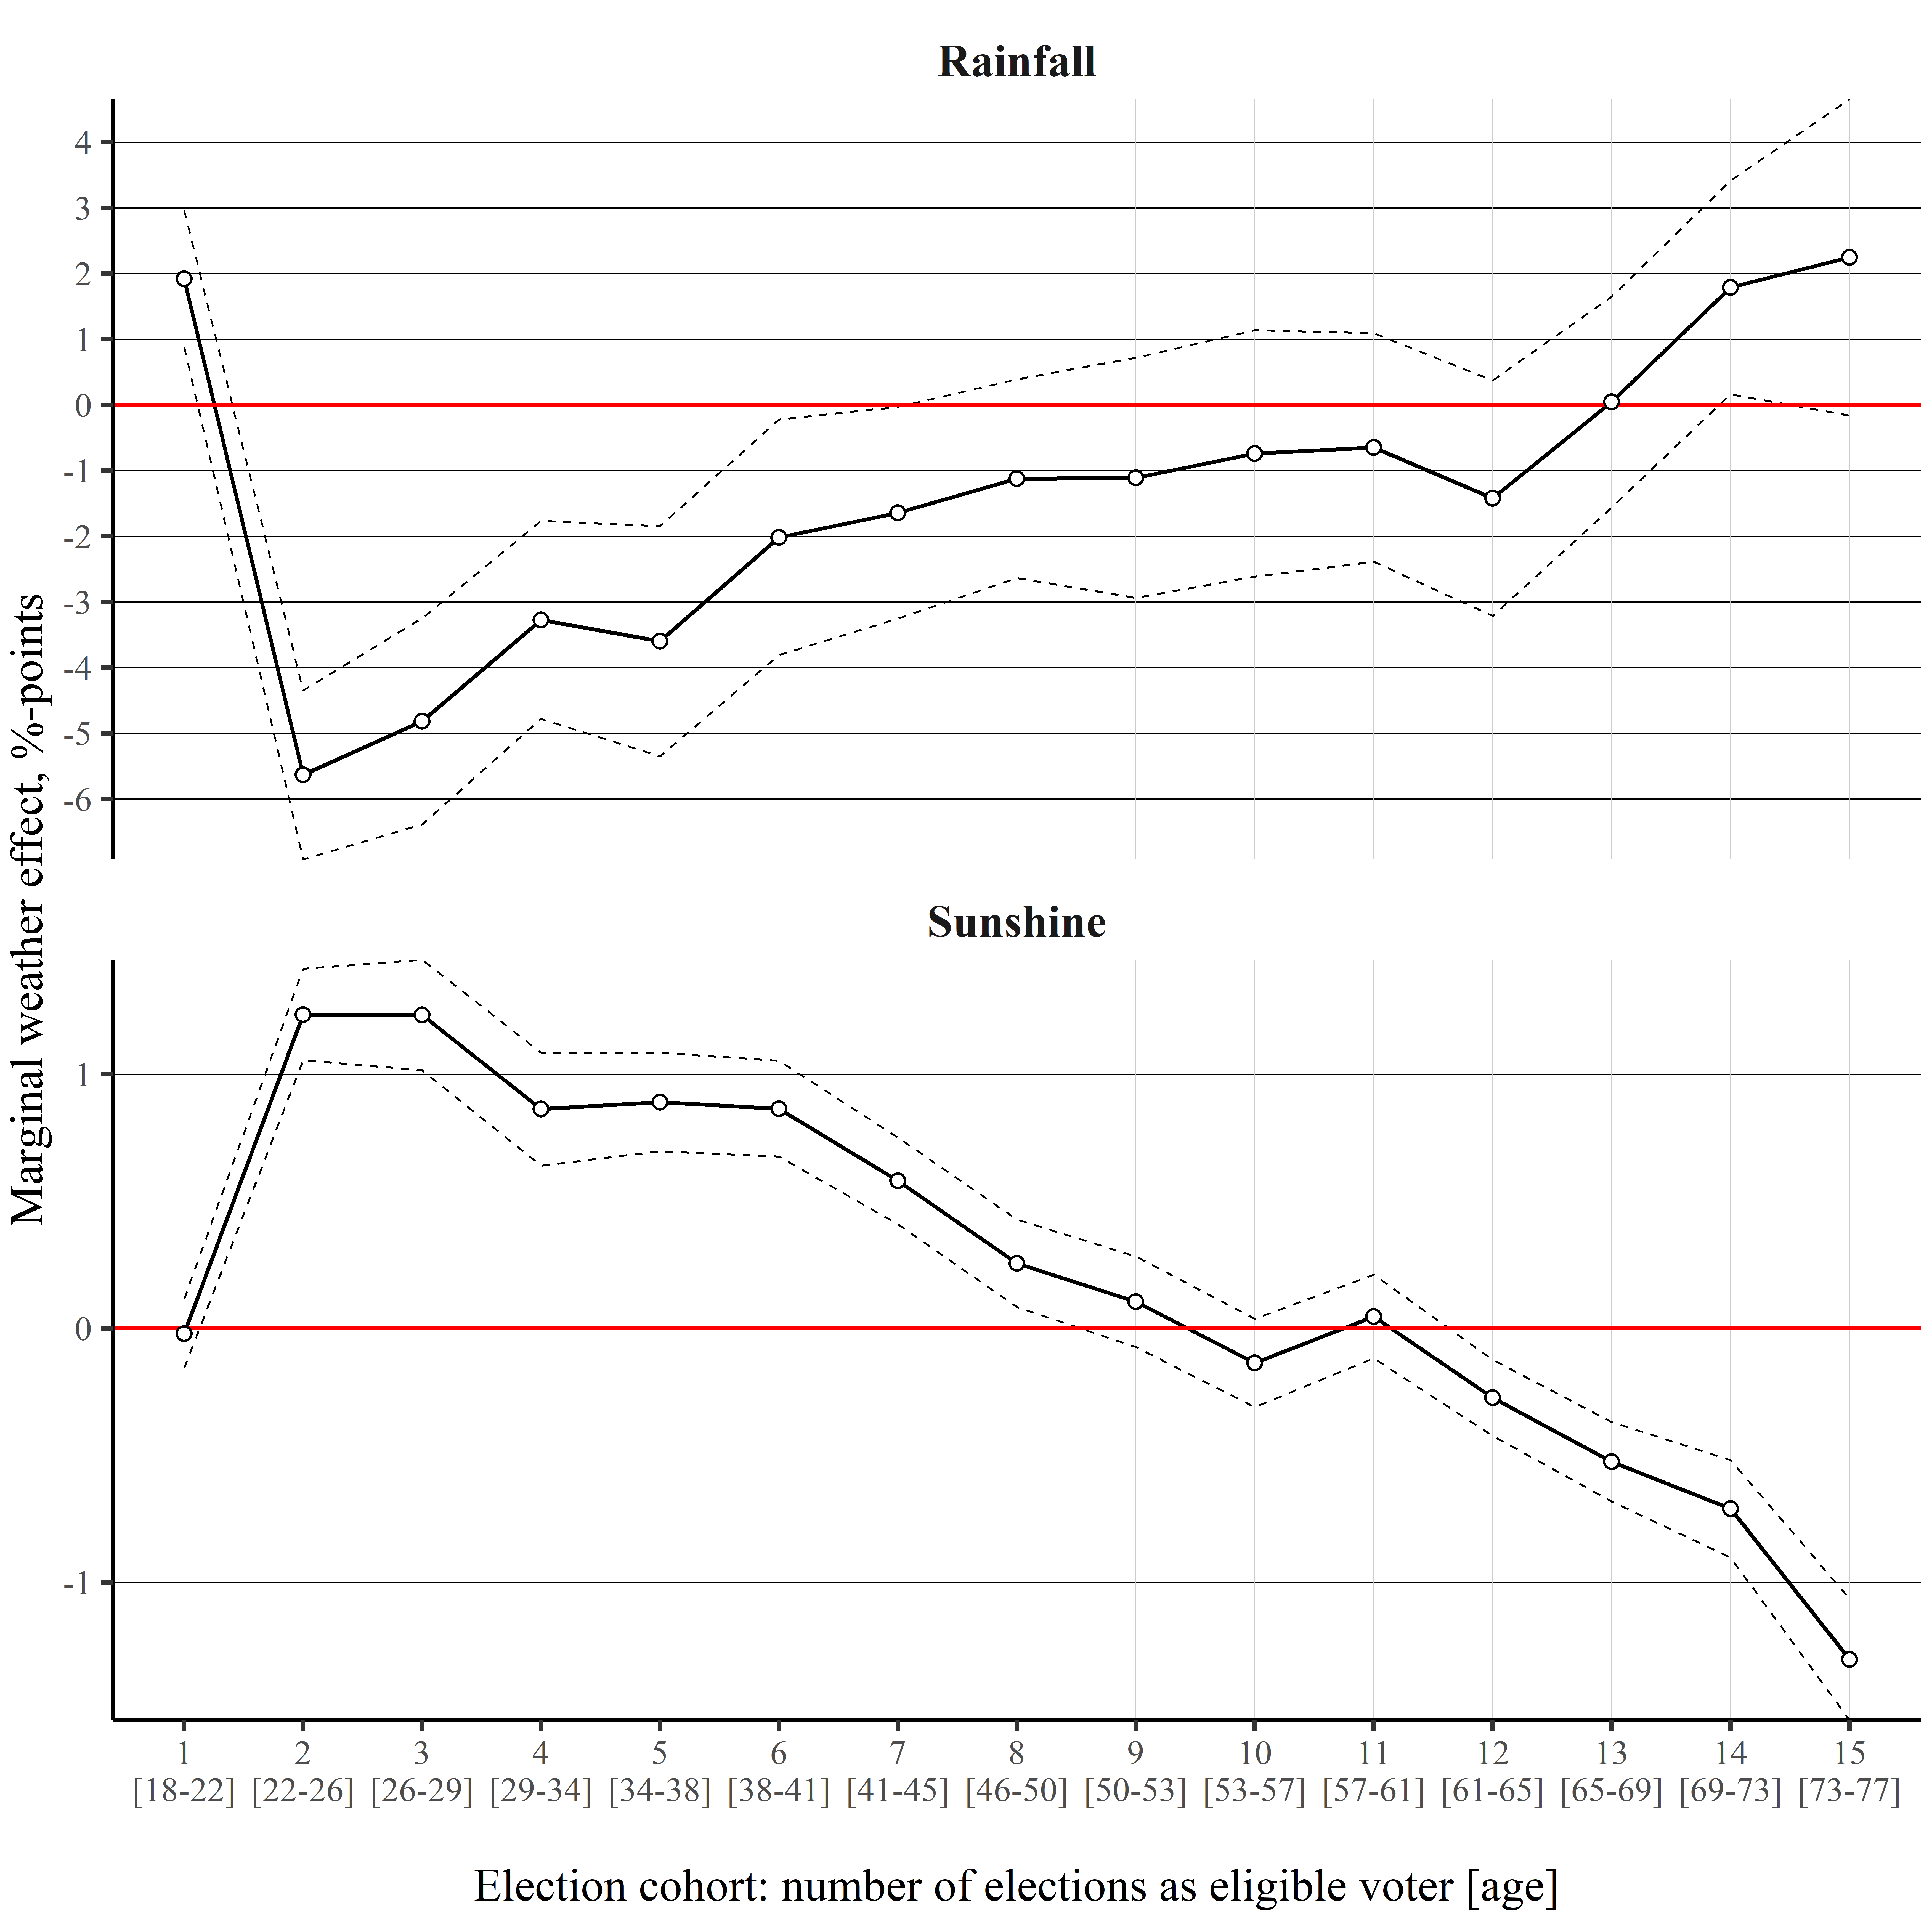
- Young voters!
A quick summary –
How does the weather affect electoral turnout?
- Experienced weather shapes turnout
- Rainfall reduces turnout by 1 %-point per 1 cm
- Stronger effect of extreme weather
- Young voters most susceptible
- Implications for democratic representation
- … climate change?
<Supplementary material in Section 11>
Conclusion
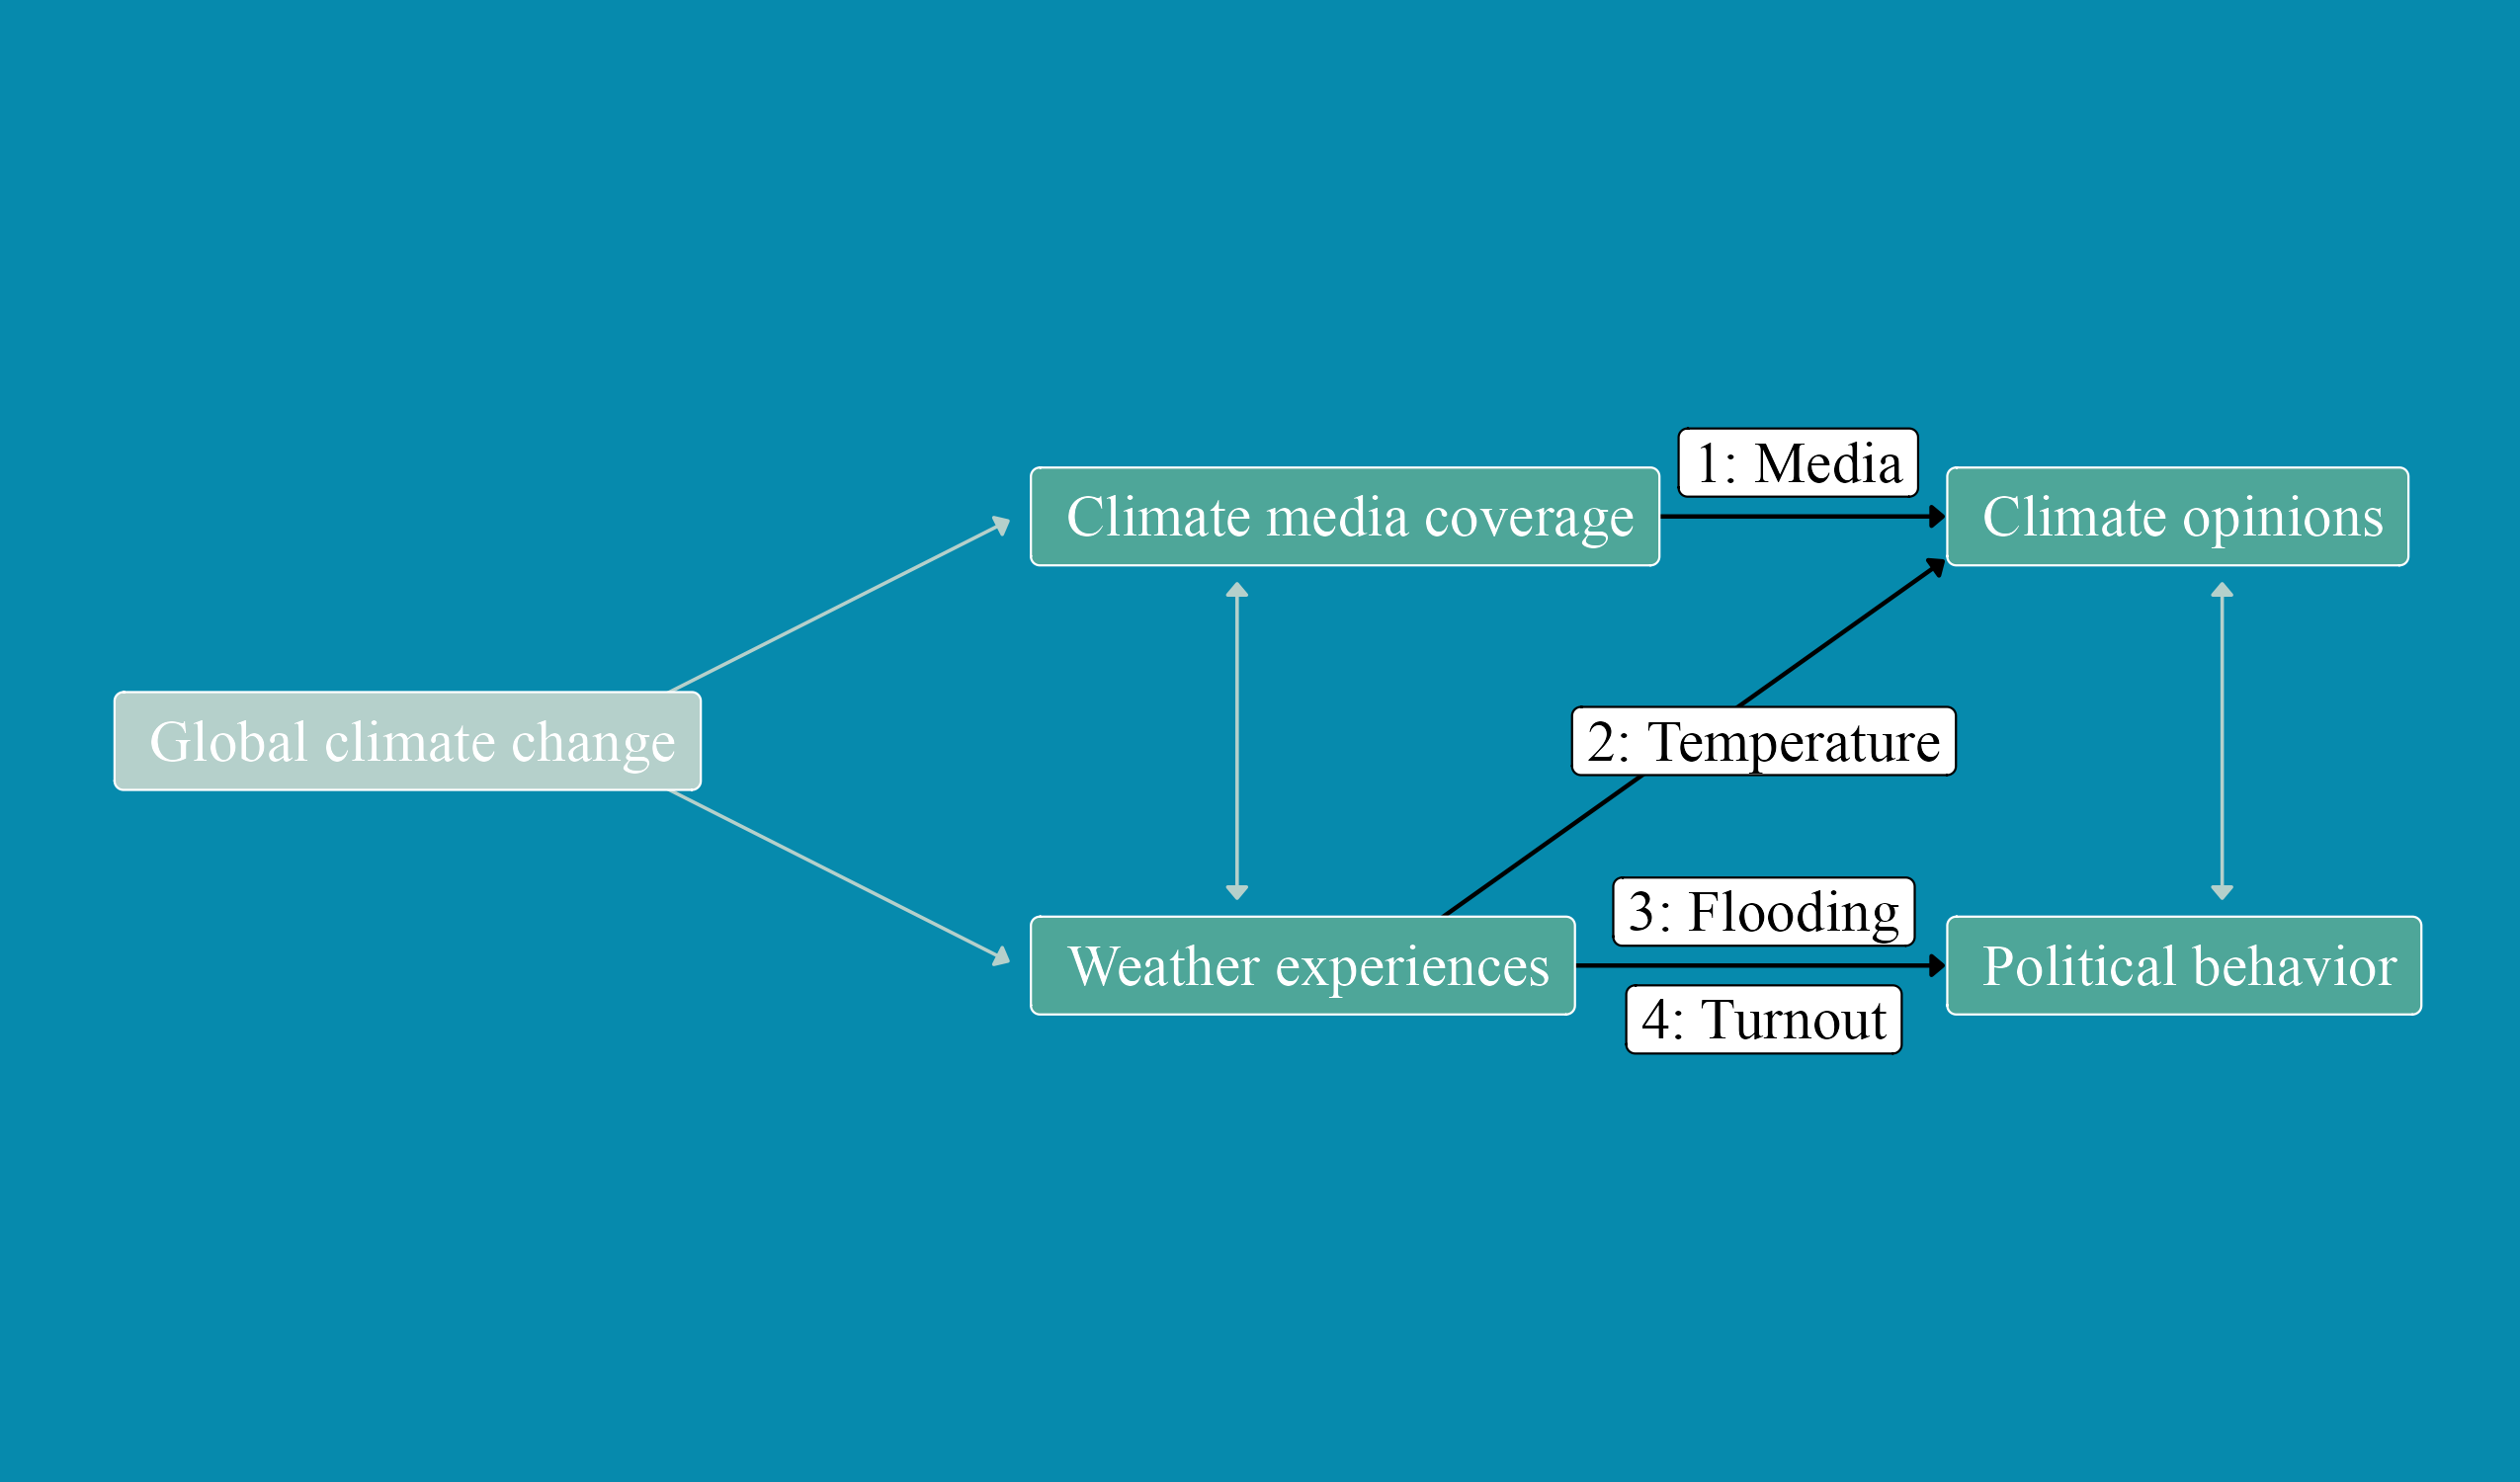
Research Question: How are voters’ climate opinions and behavior shaped by media coverage of climate change and personal weather experiences?
- Positive or “constructive” responses to climate change
- Climate change – a self-correcting problem?
- Responsibility of political elites
- “Political Weather”
- Everyday experiences
Overview
- Introduction → Section 1
- 1: Media → Section 2.1
- Summary in Section 2.6
- Supplementary material in Section 8
- 2: Temperature → Section 3.1
- Summary in Section 3.6
- Supplementary material in Section 9
- 3: Flooding → Section 4.1
- Summary in Section 4.12
- Supplementary material in Section 10
- 4: Turnout → Section 5.1
- Summary in Section 5.8
- Supplementary material in Section 11
- Conclusion → Section 6
Weekly media coverage
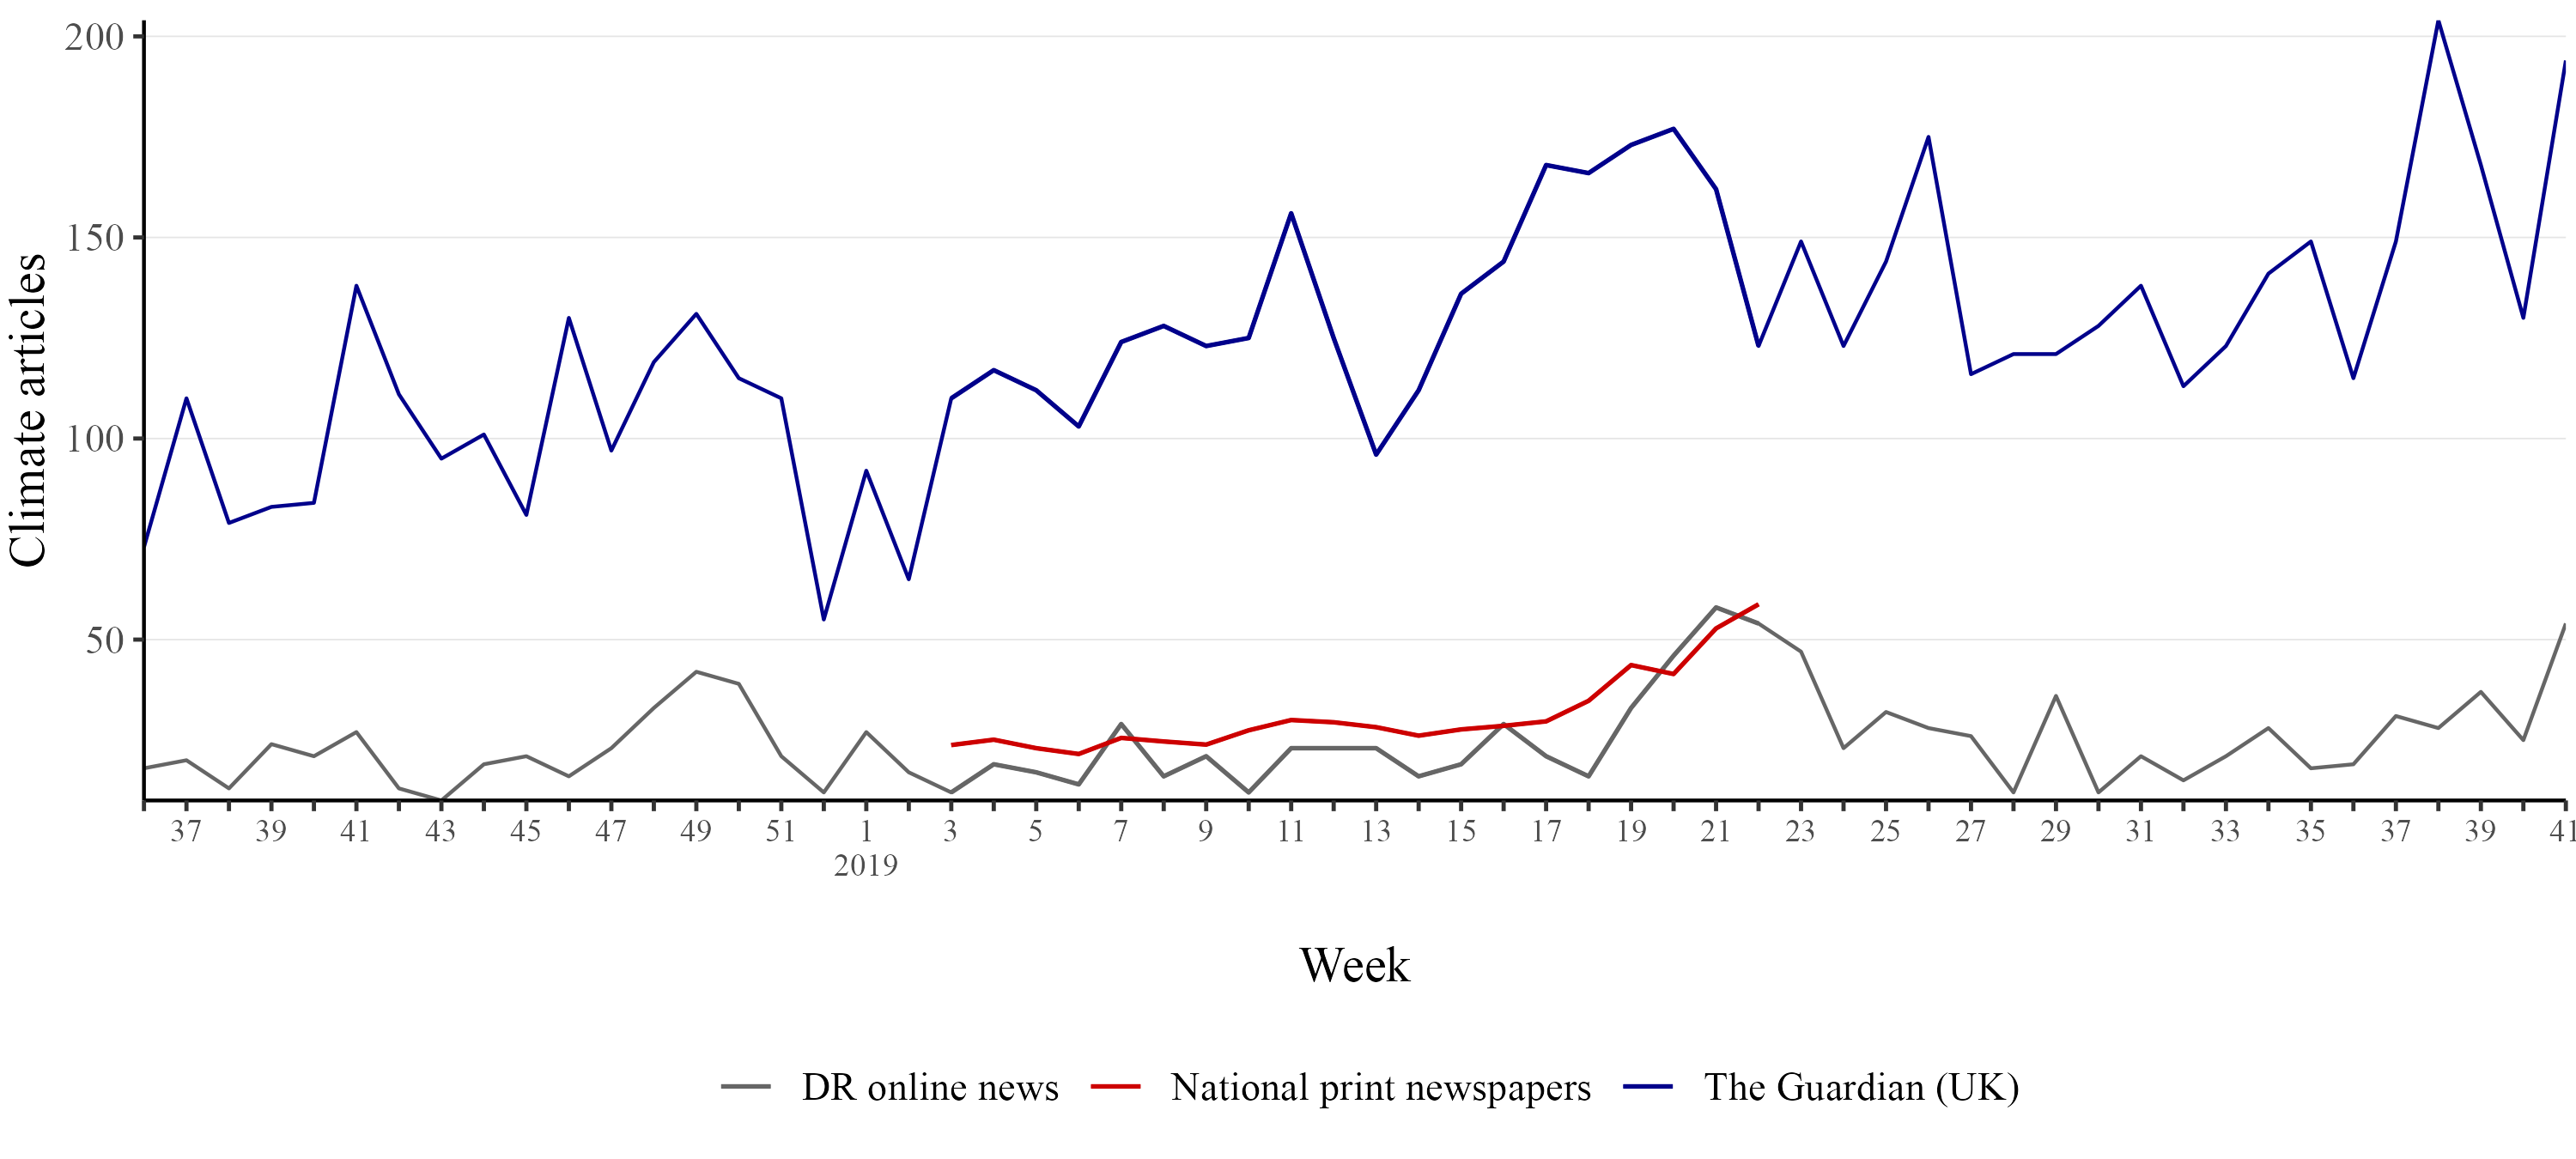
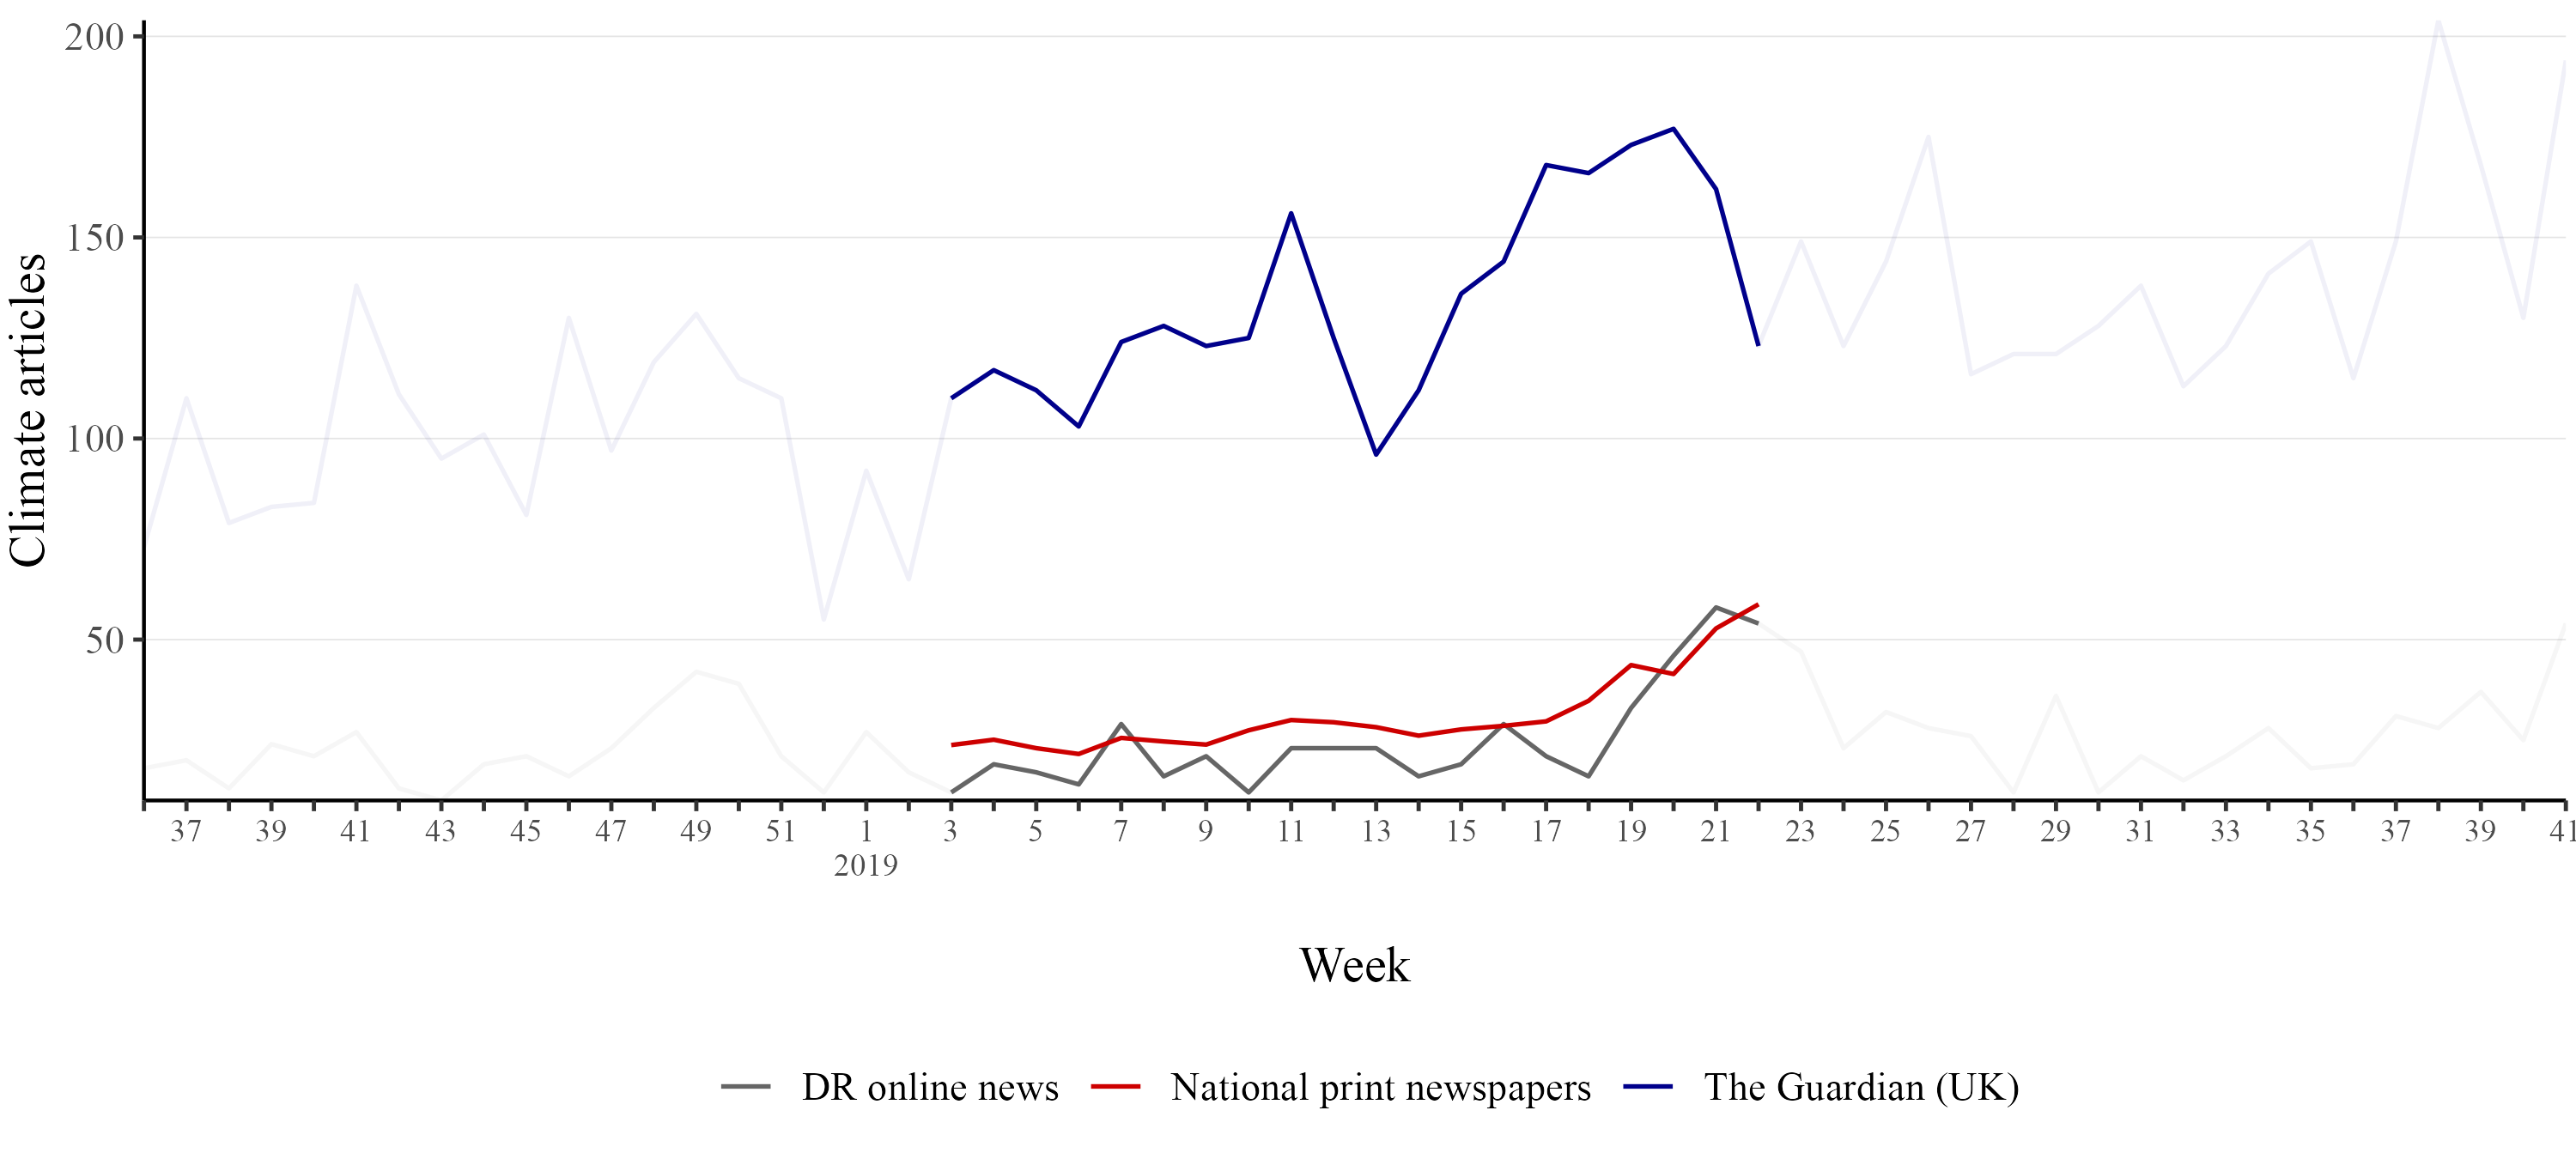
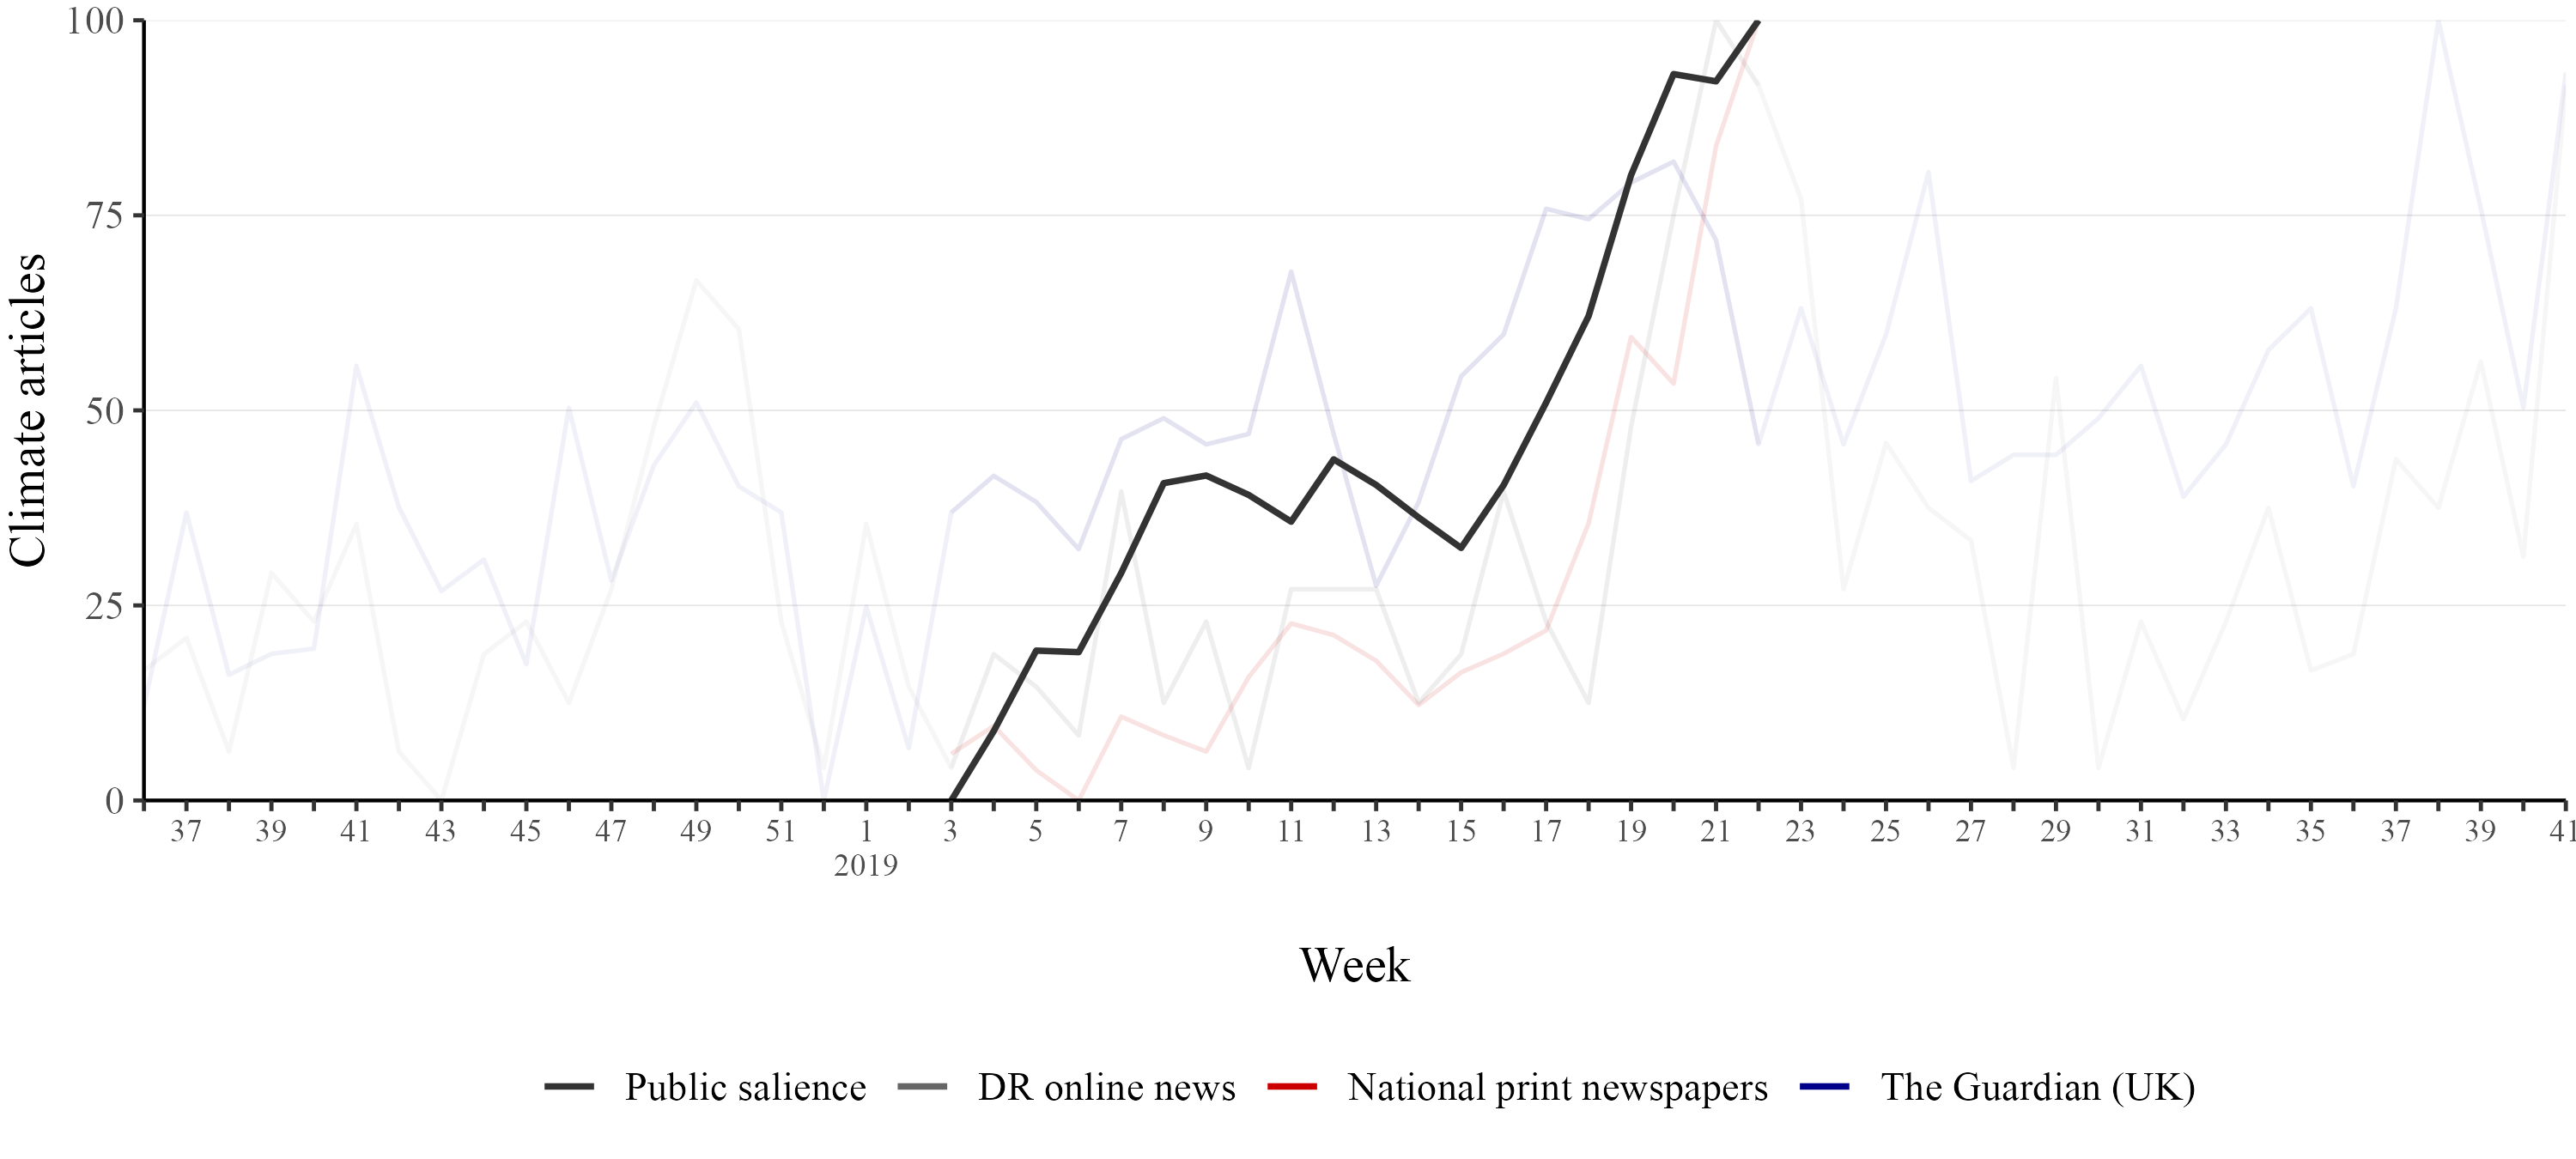
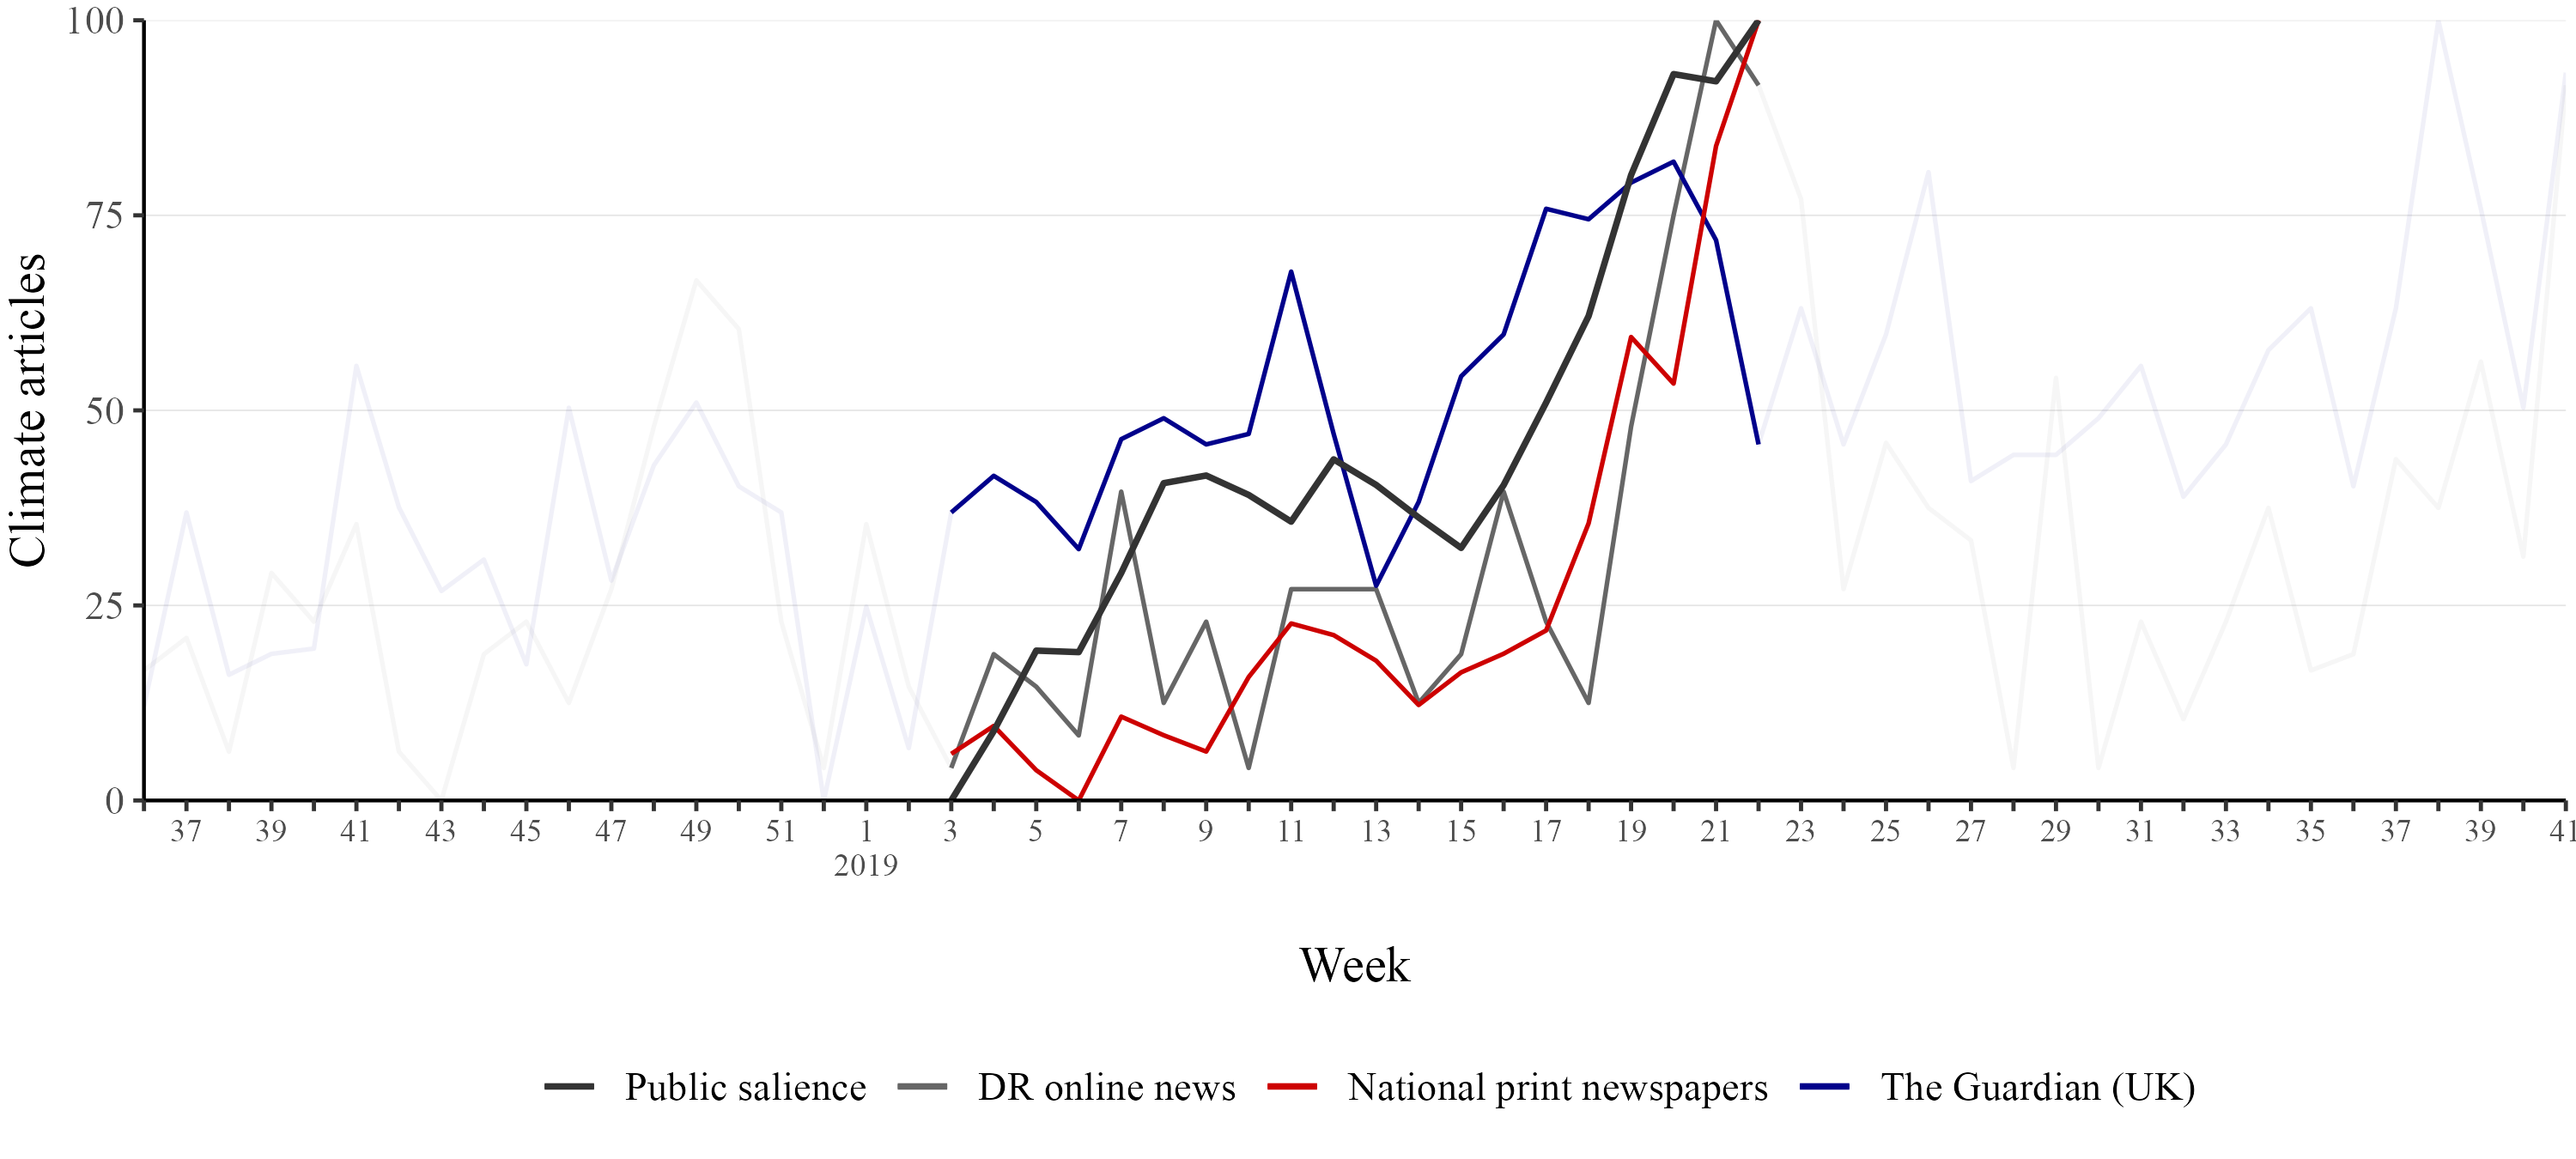
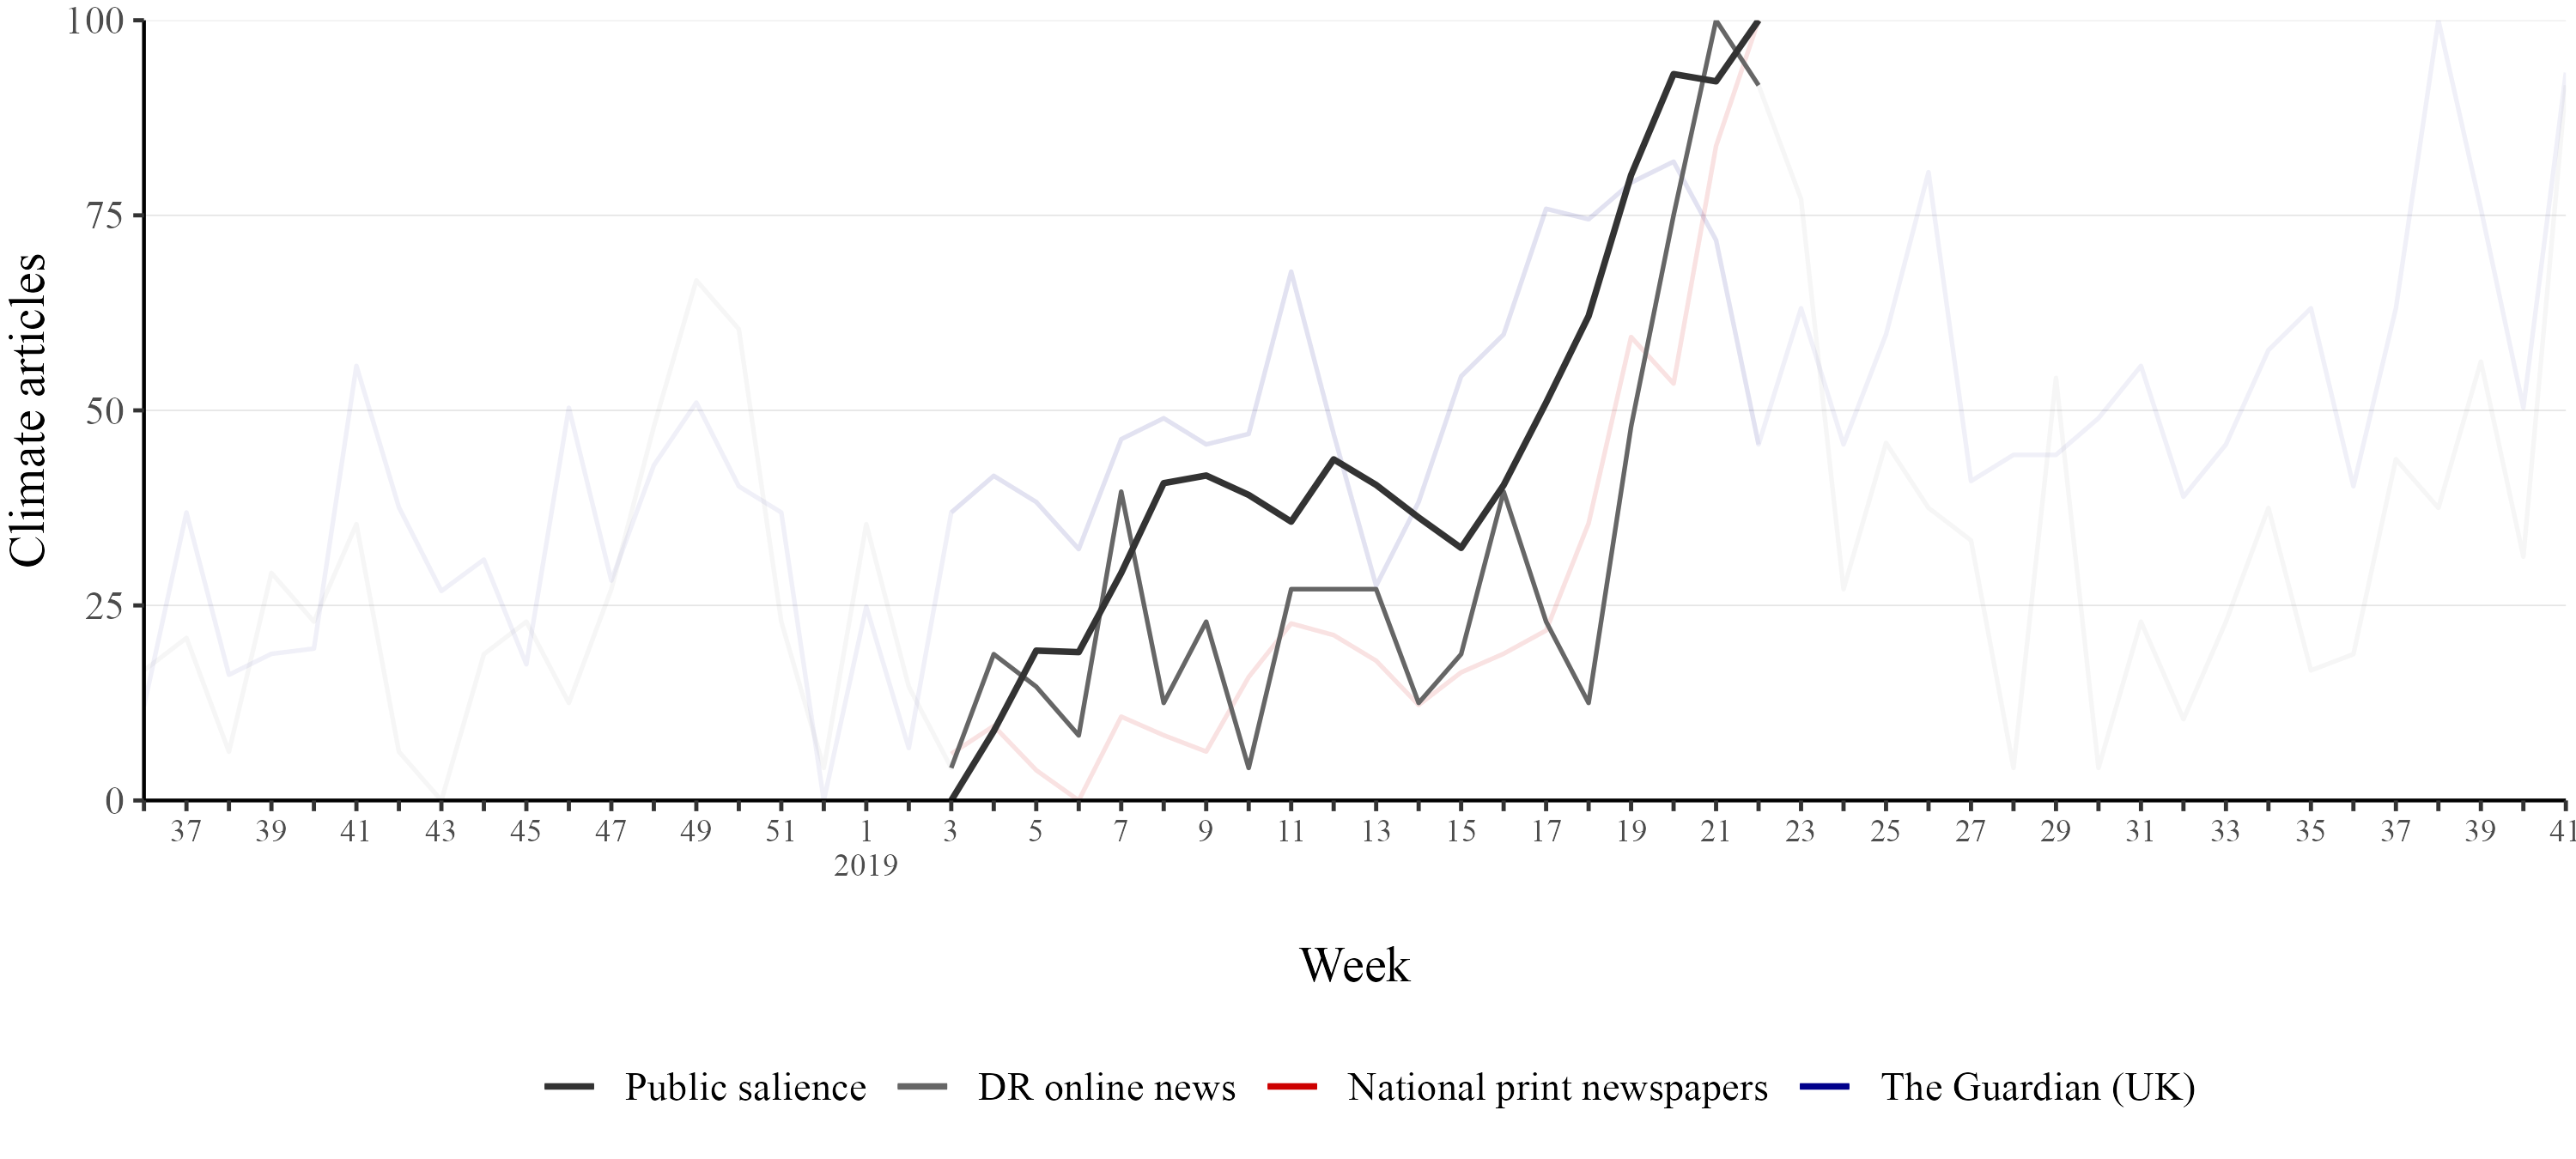
<Section 2.4 shows the main time series>
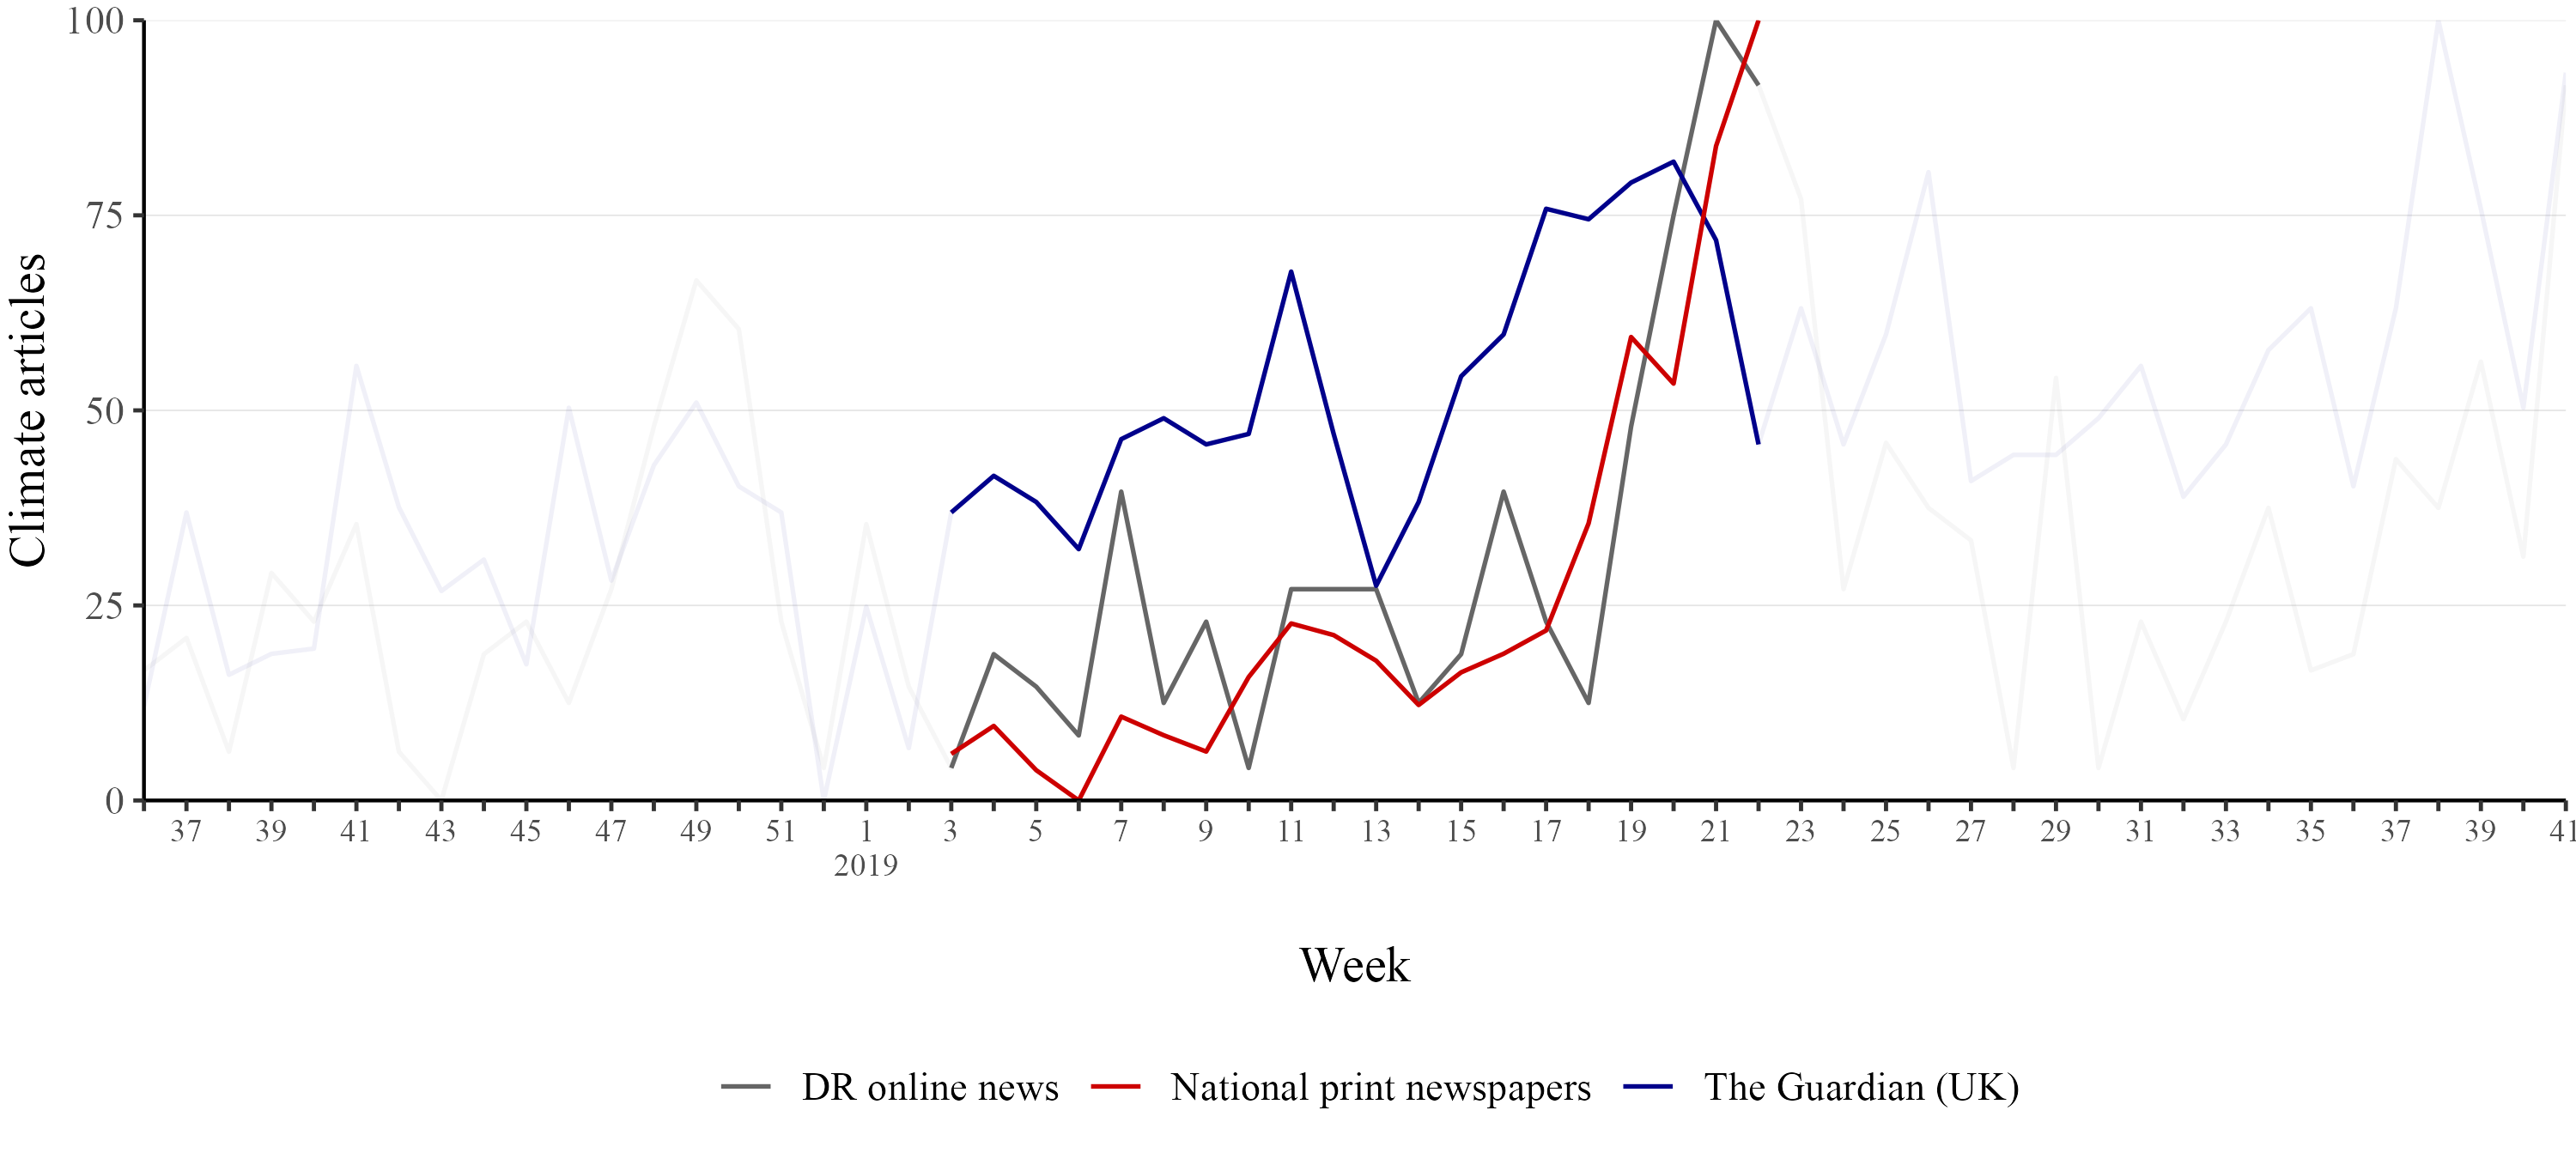
Time series decomposition
Residual variance = VAR model input

<Section 2.4 shows the main time series>
Statistical results
Cross-lagged panel correlation
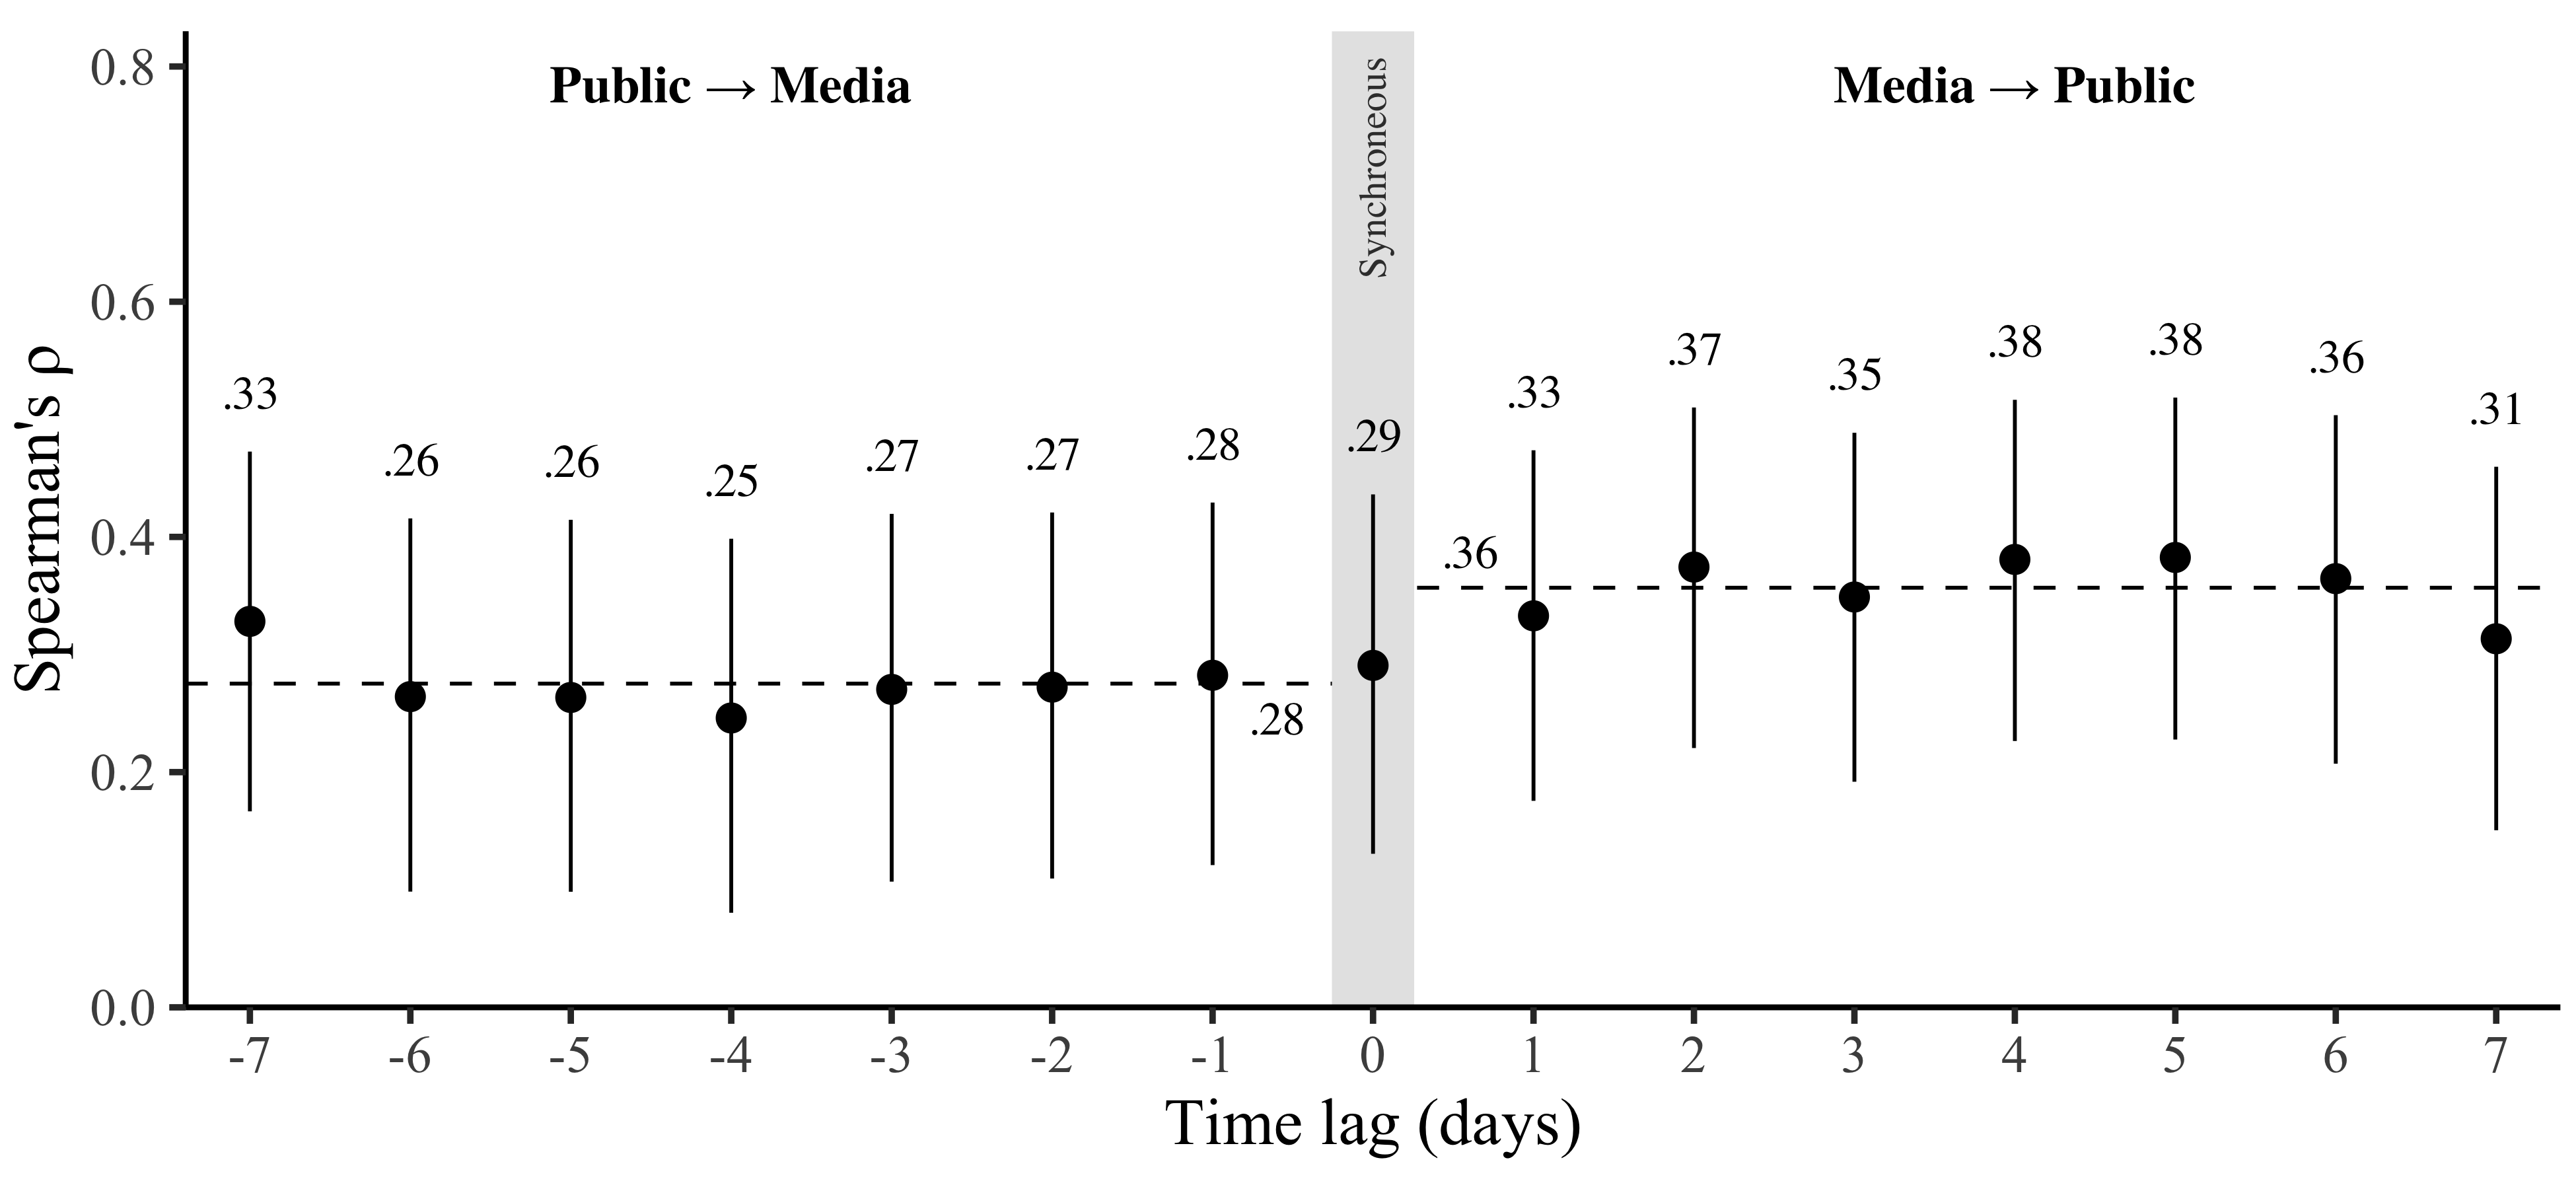
<Section 2.5 summarises the results>
Statistical results
Vector autoregression model

<Section 2.5 summarises the results>
Statistical results
Vector autoregression model with varying lag order
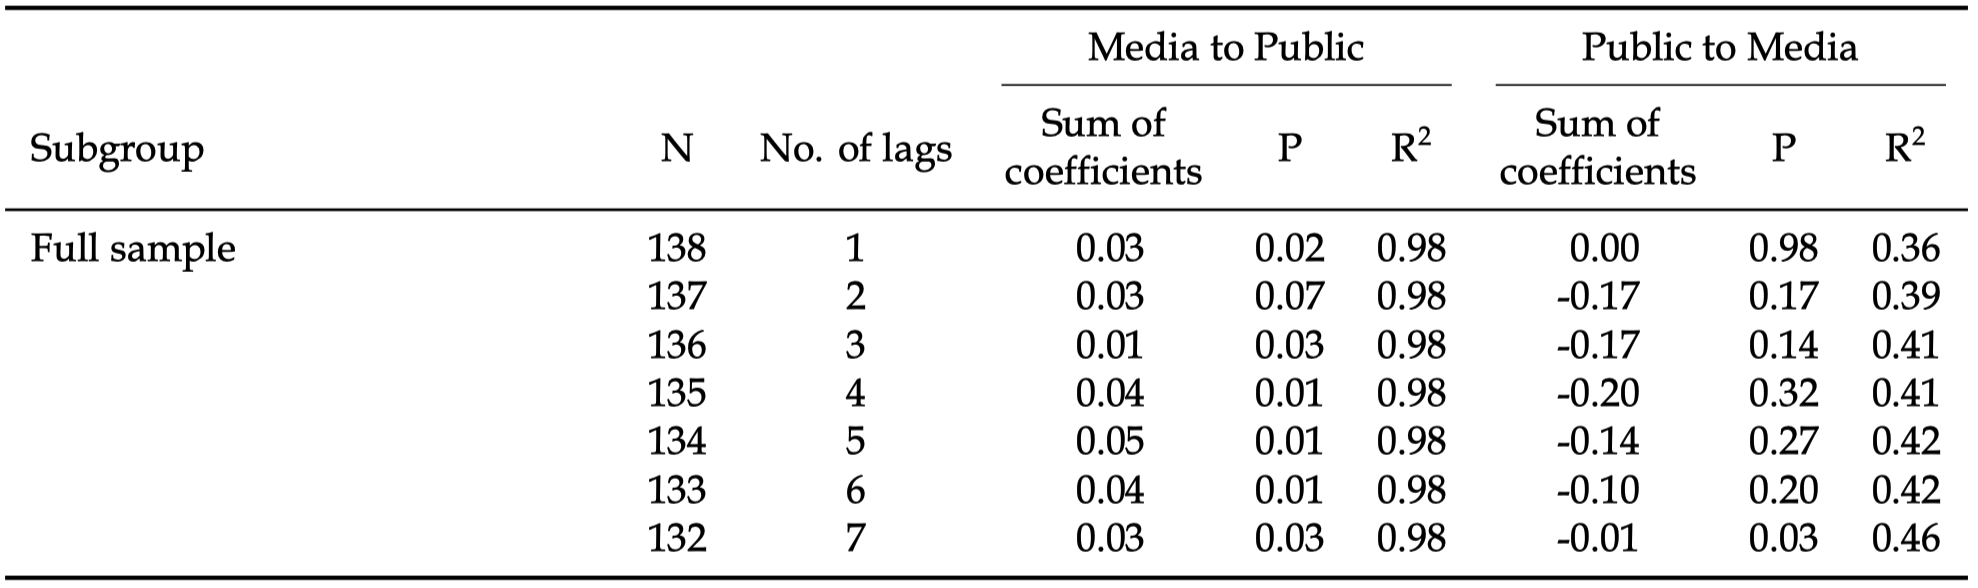
<Section 2.5 summarises the results>
Who is responsive to media climate coverage?
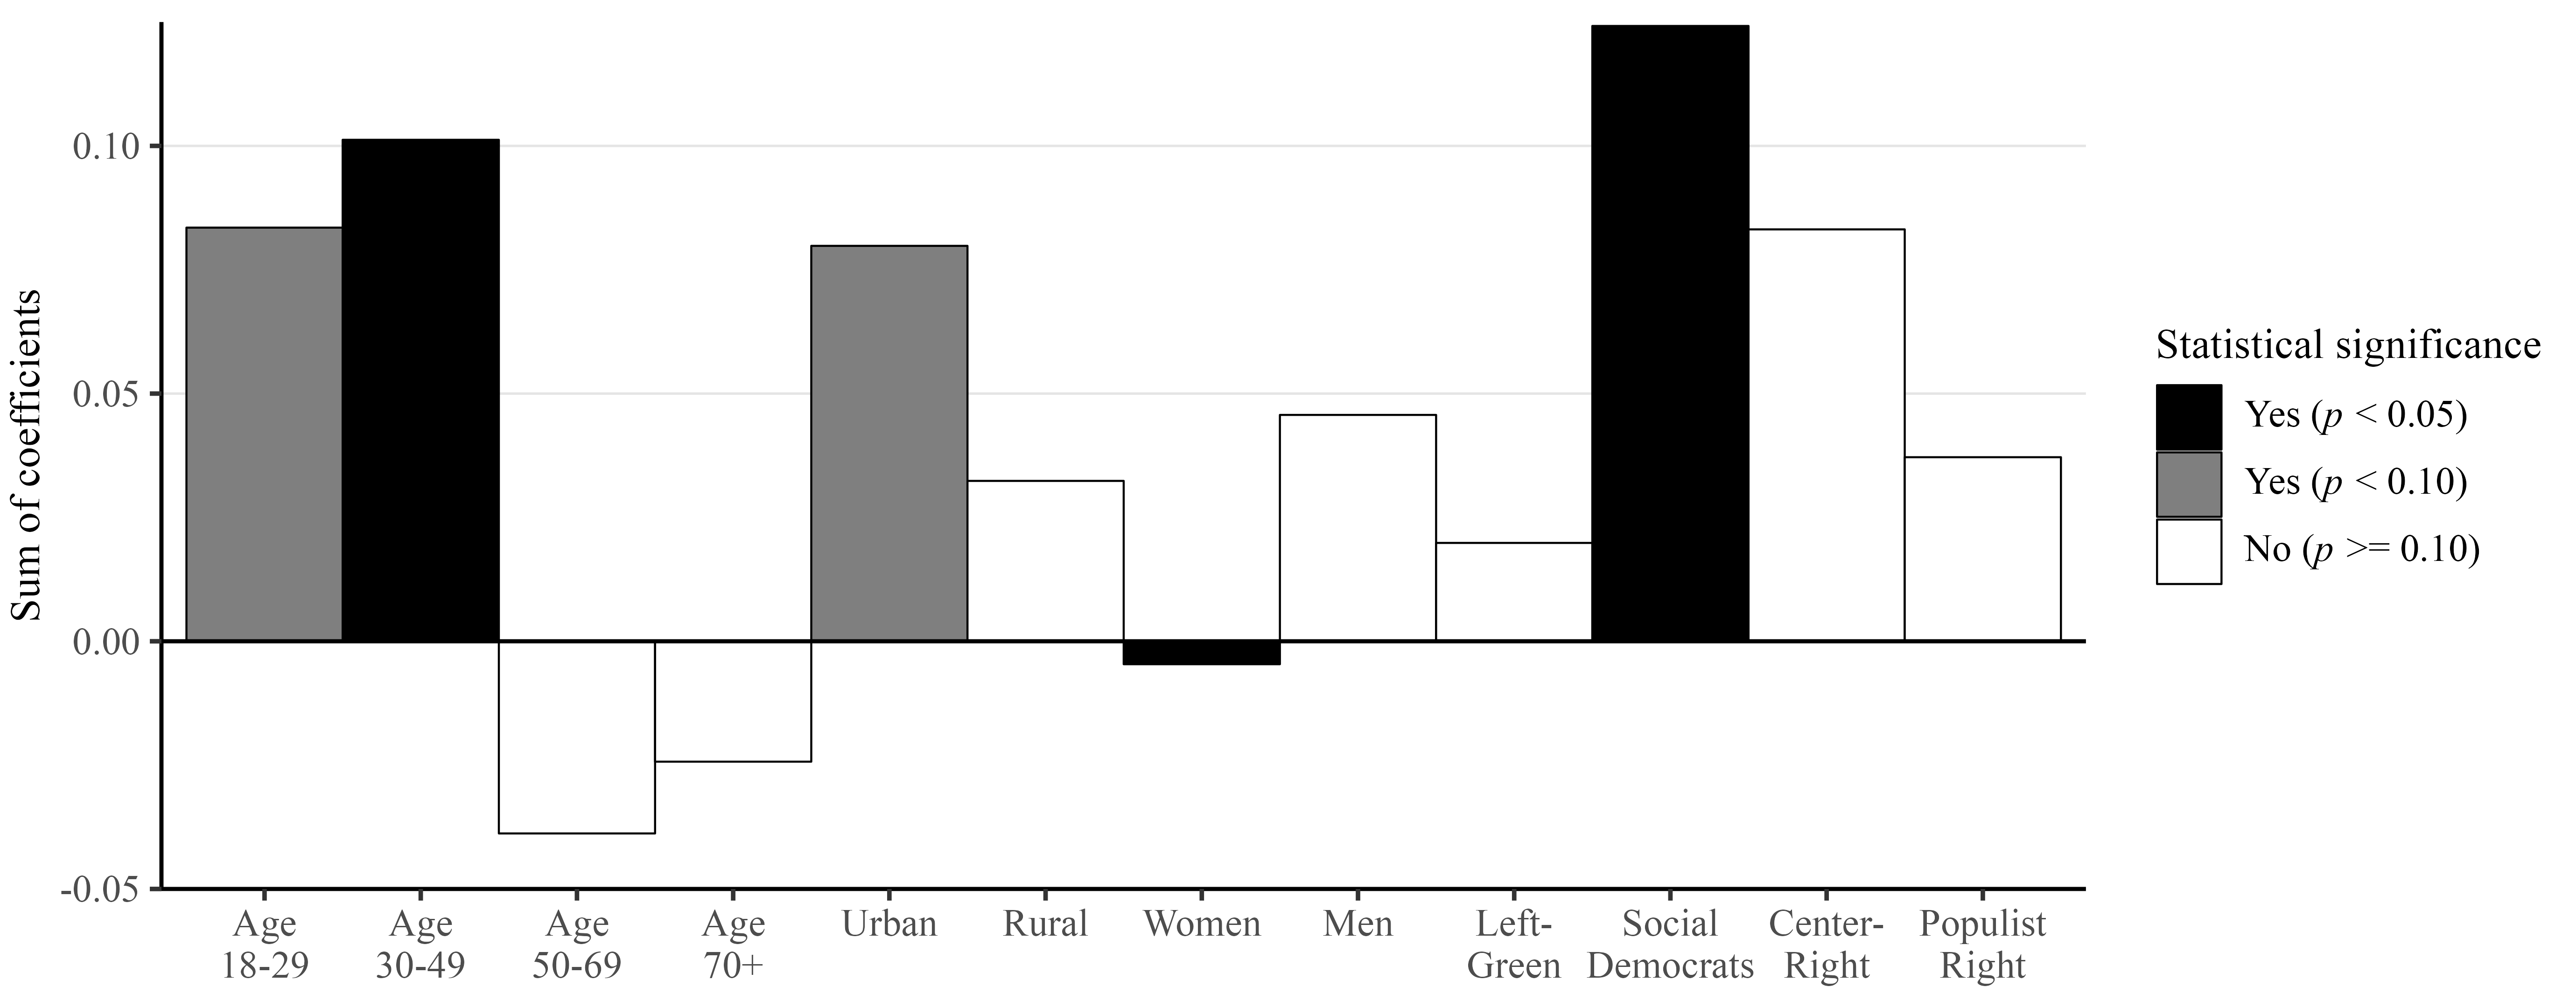
- Education: Age 30-49
- Immigration: Age 70+, rural, men, center-right (not populist right)
<Section 2.5 summarises the results>
Temperature measure
temperature_{ct} = \frac{1}{7} \sum_{t-7}^{t-1}{mean\ temperature_{ct} - normal\ temperature_{ct}}
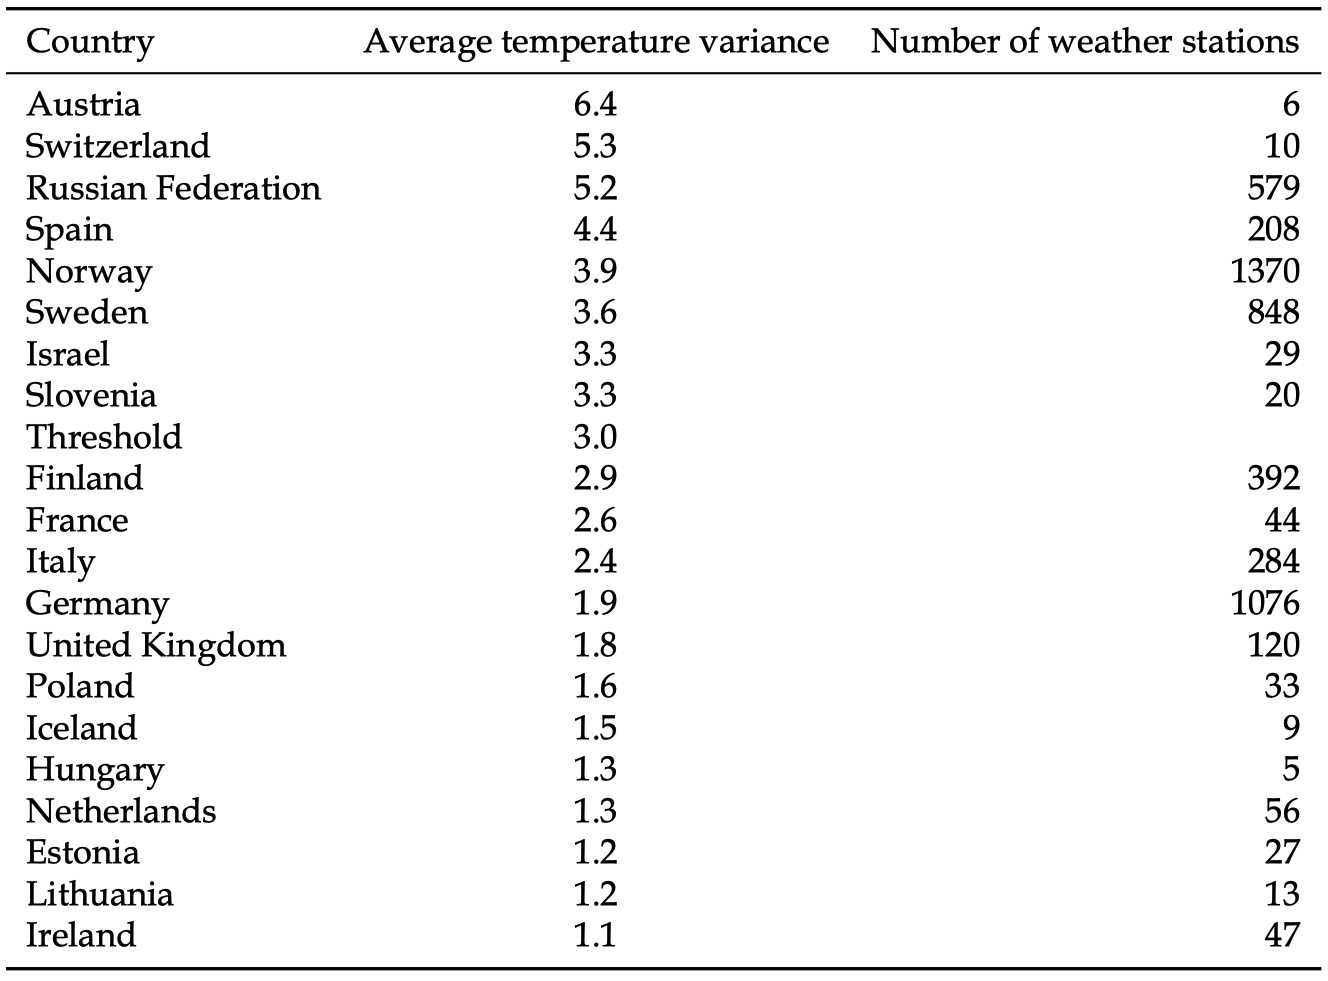
Data collection
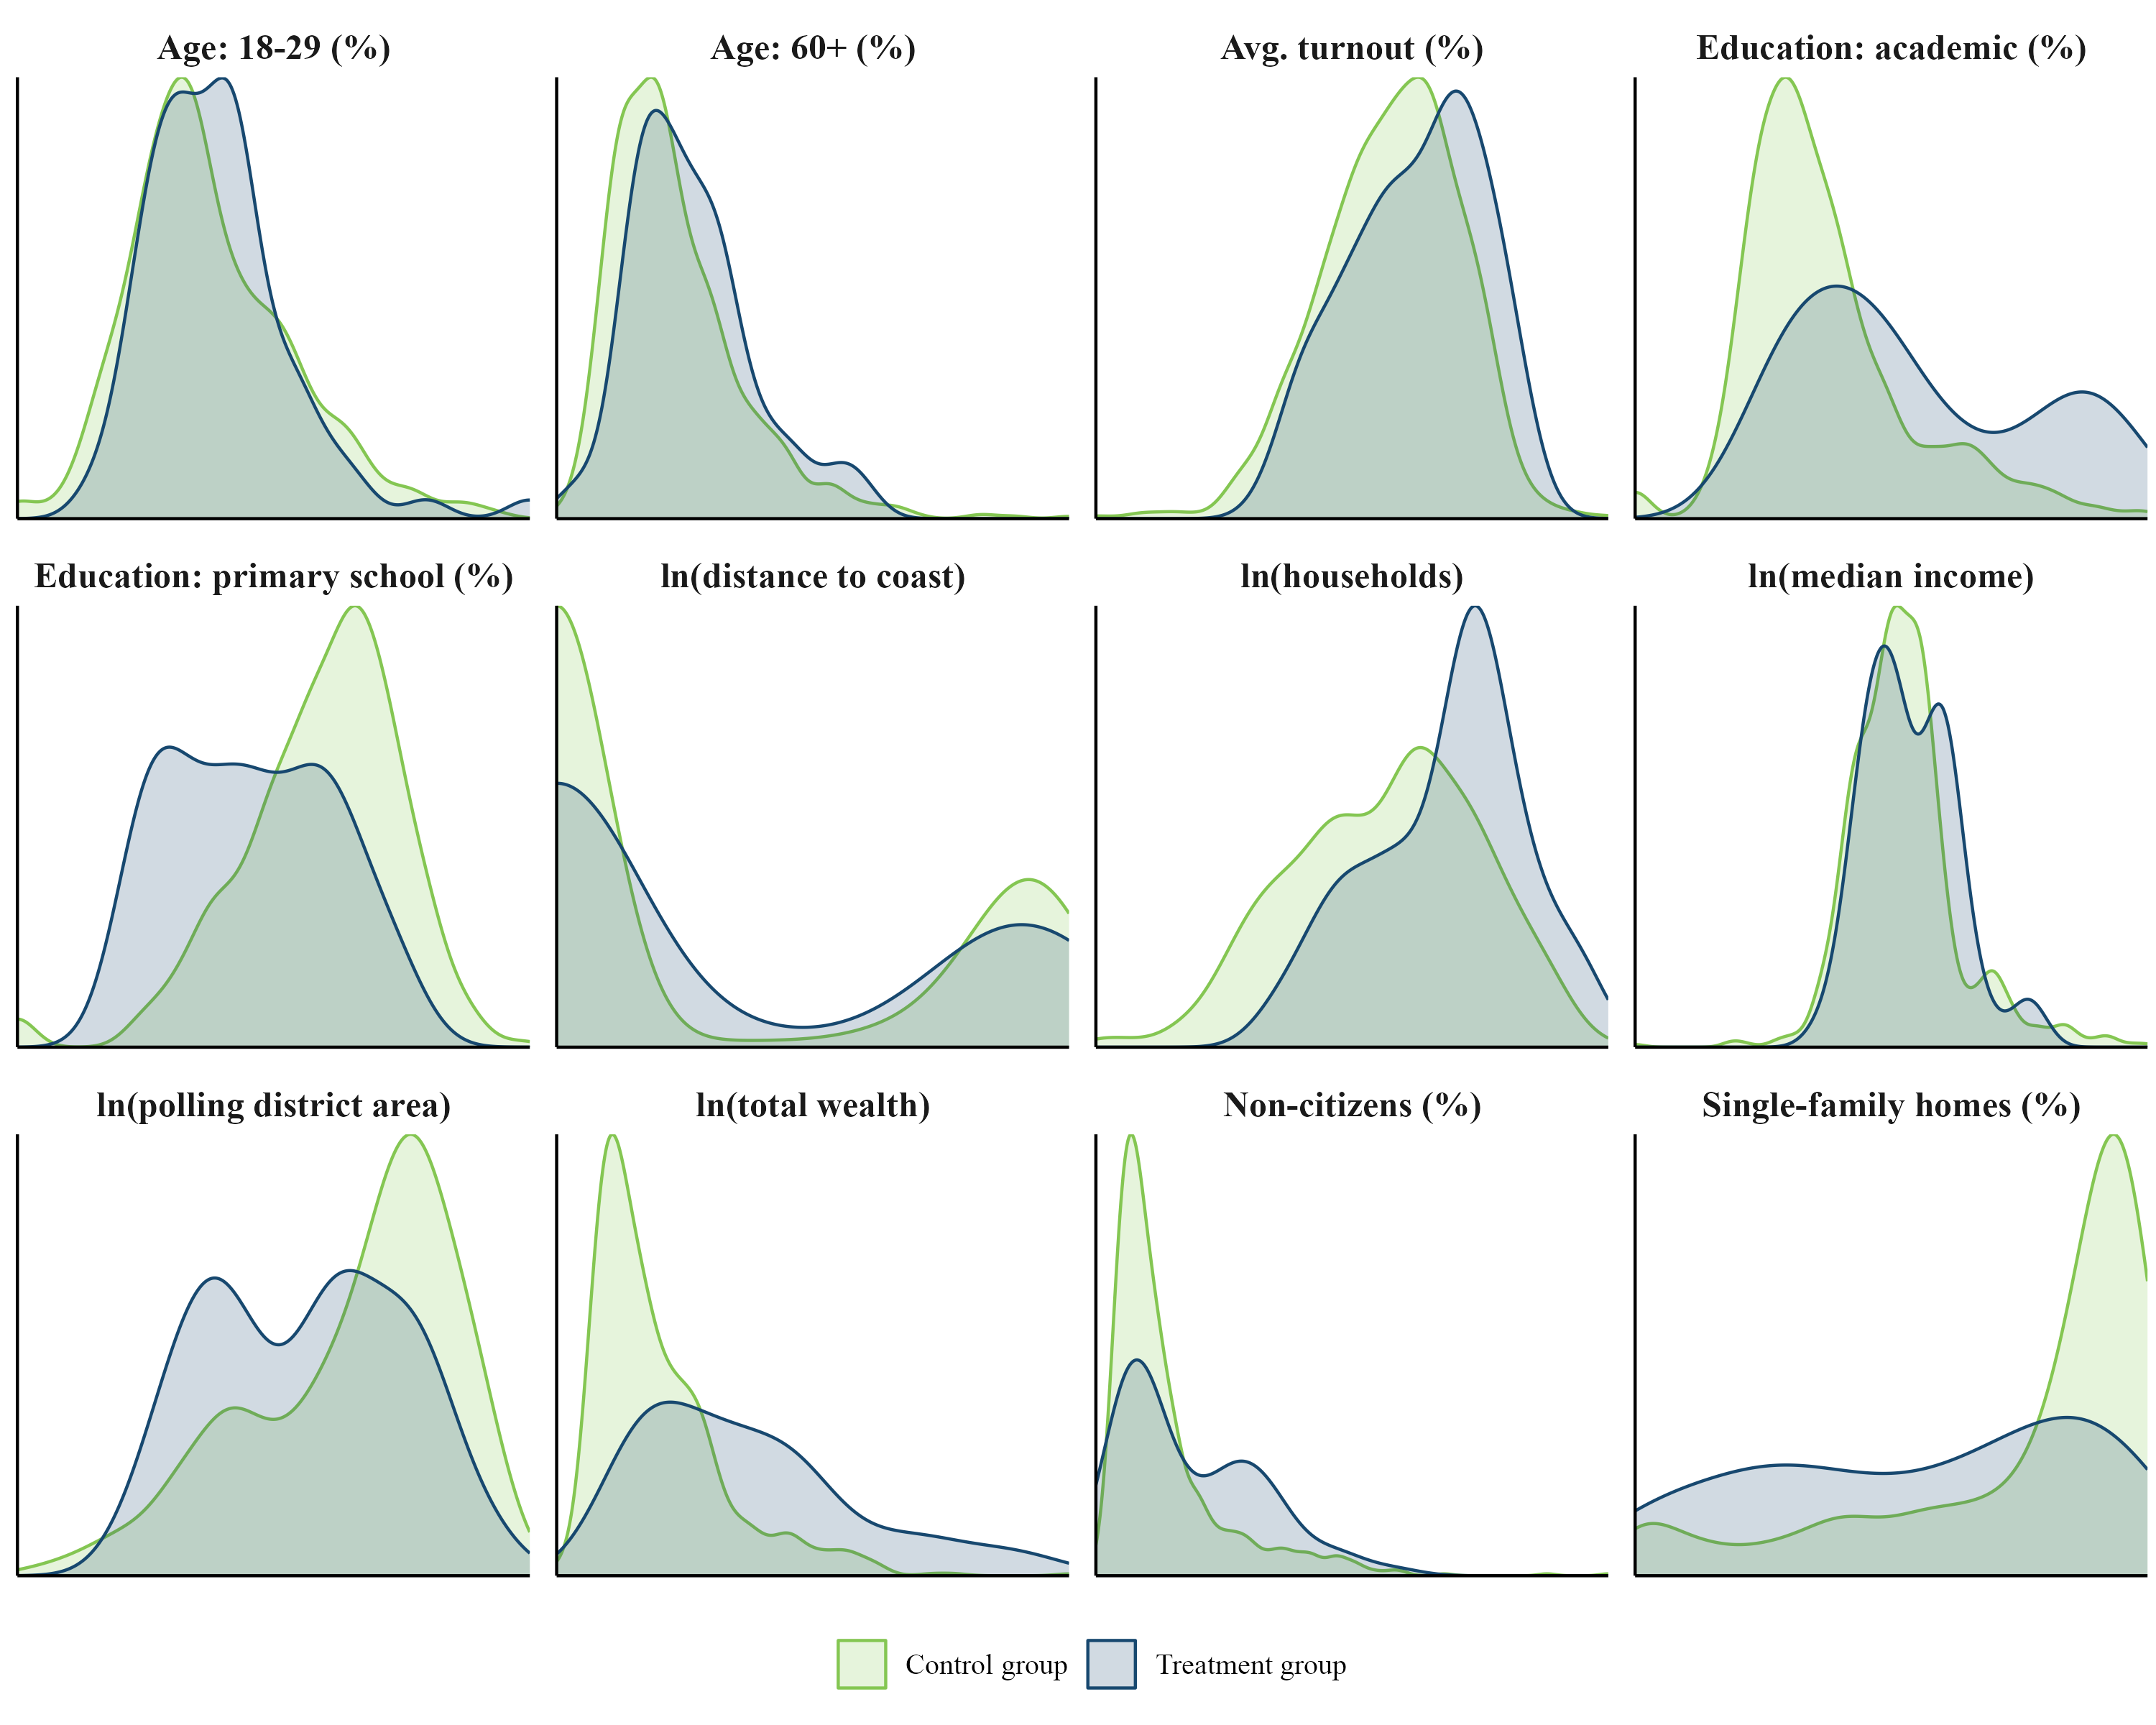
Balance check
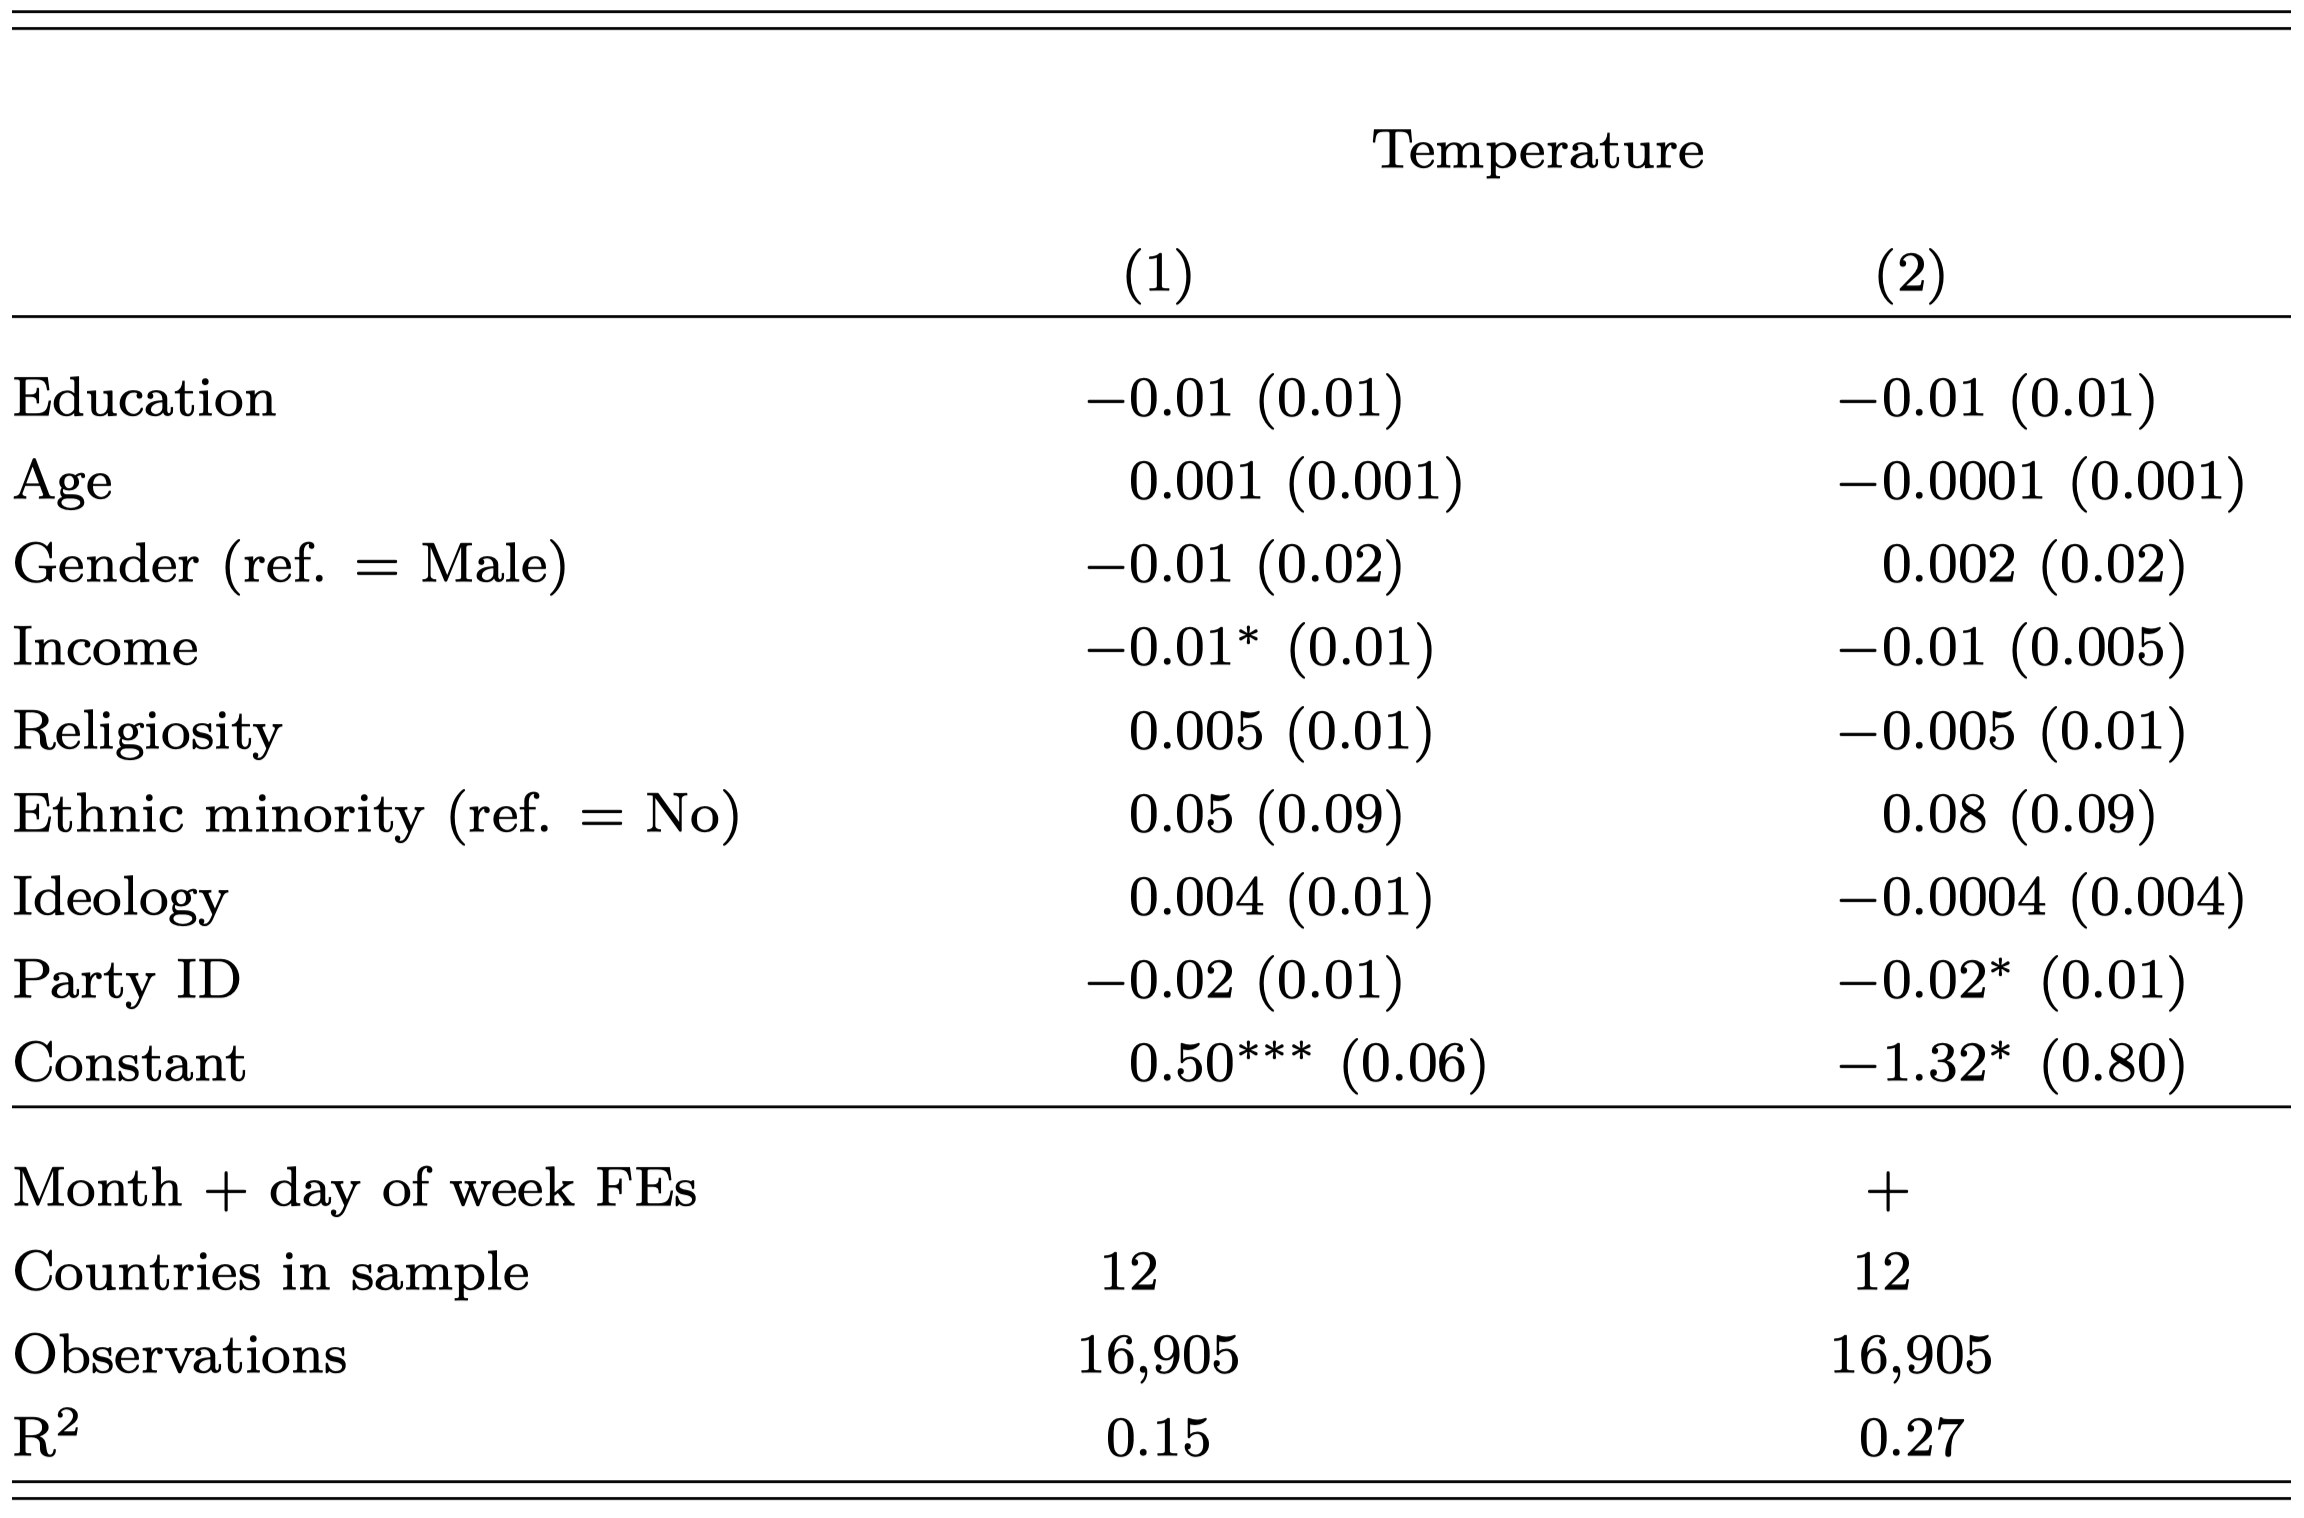
OLS model
Meta-analysis
Placebo test
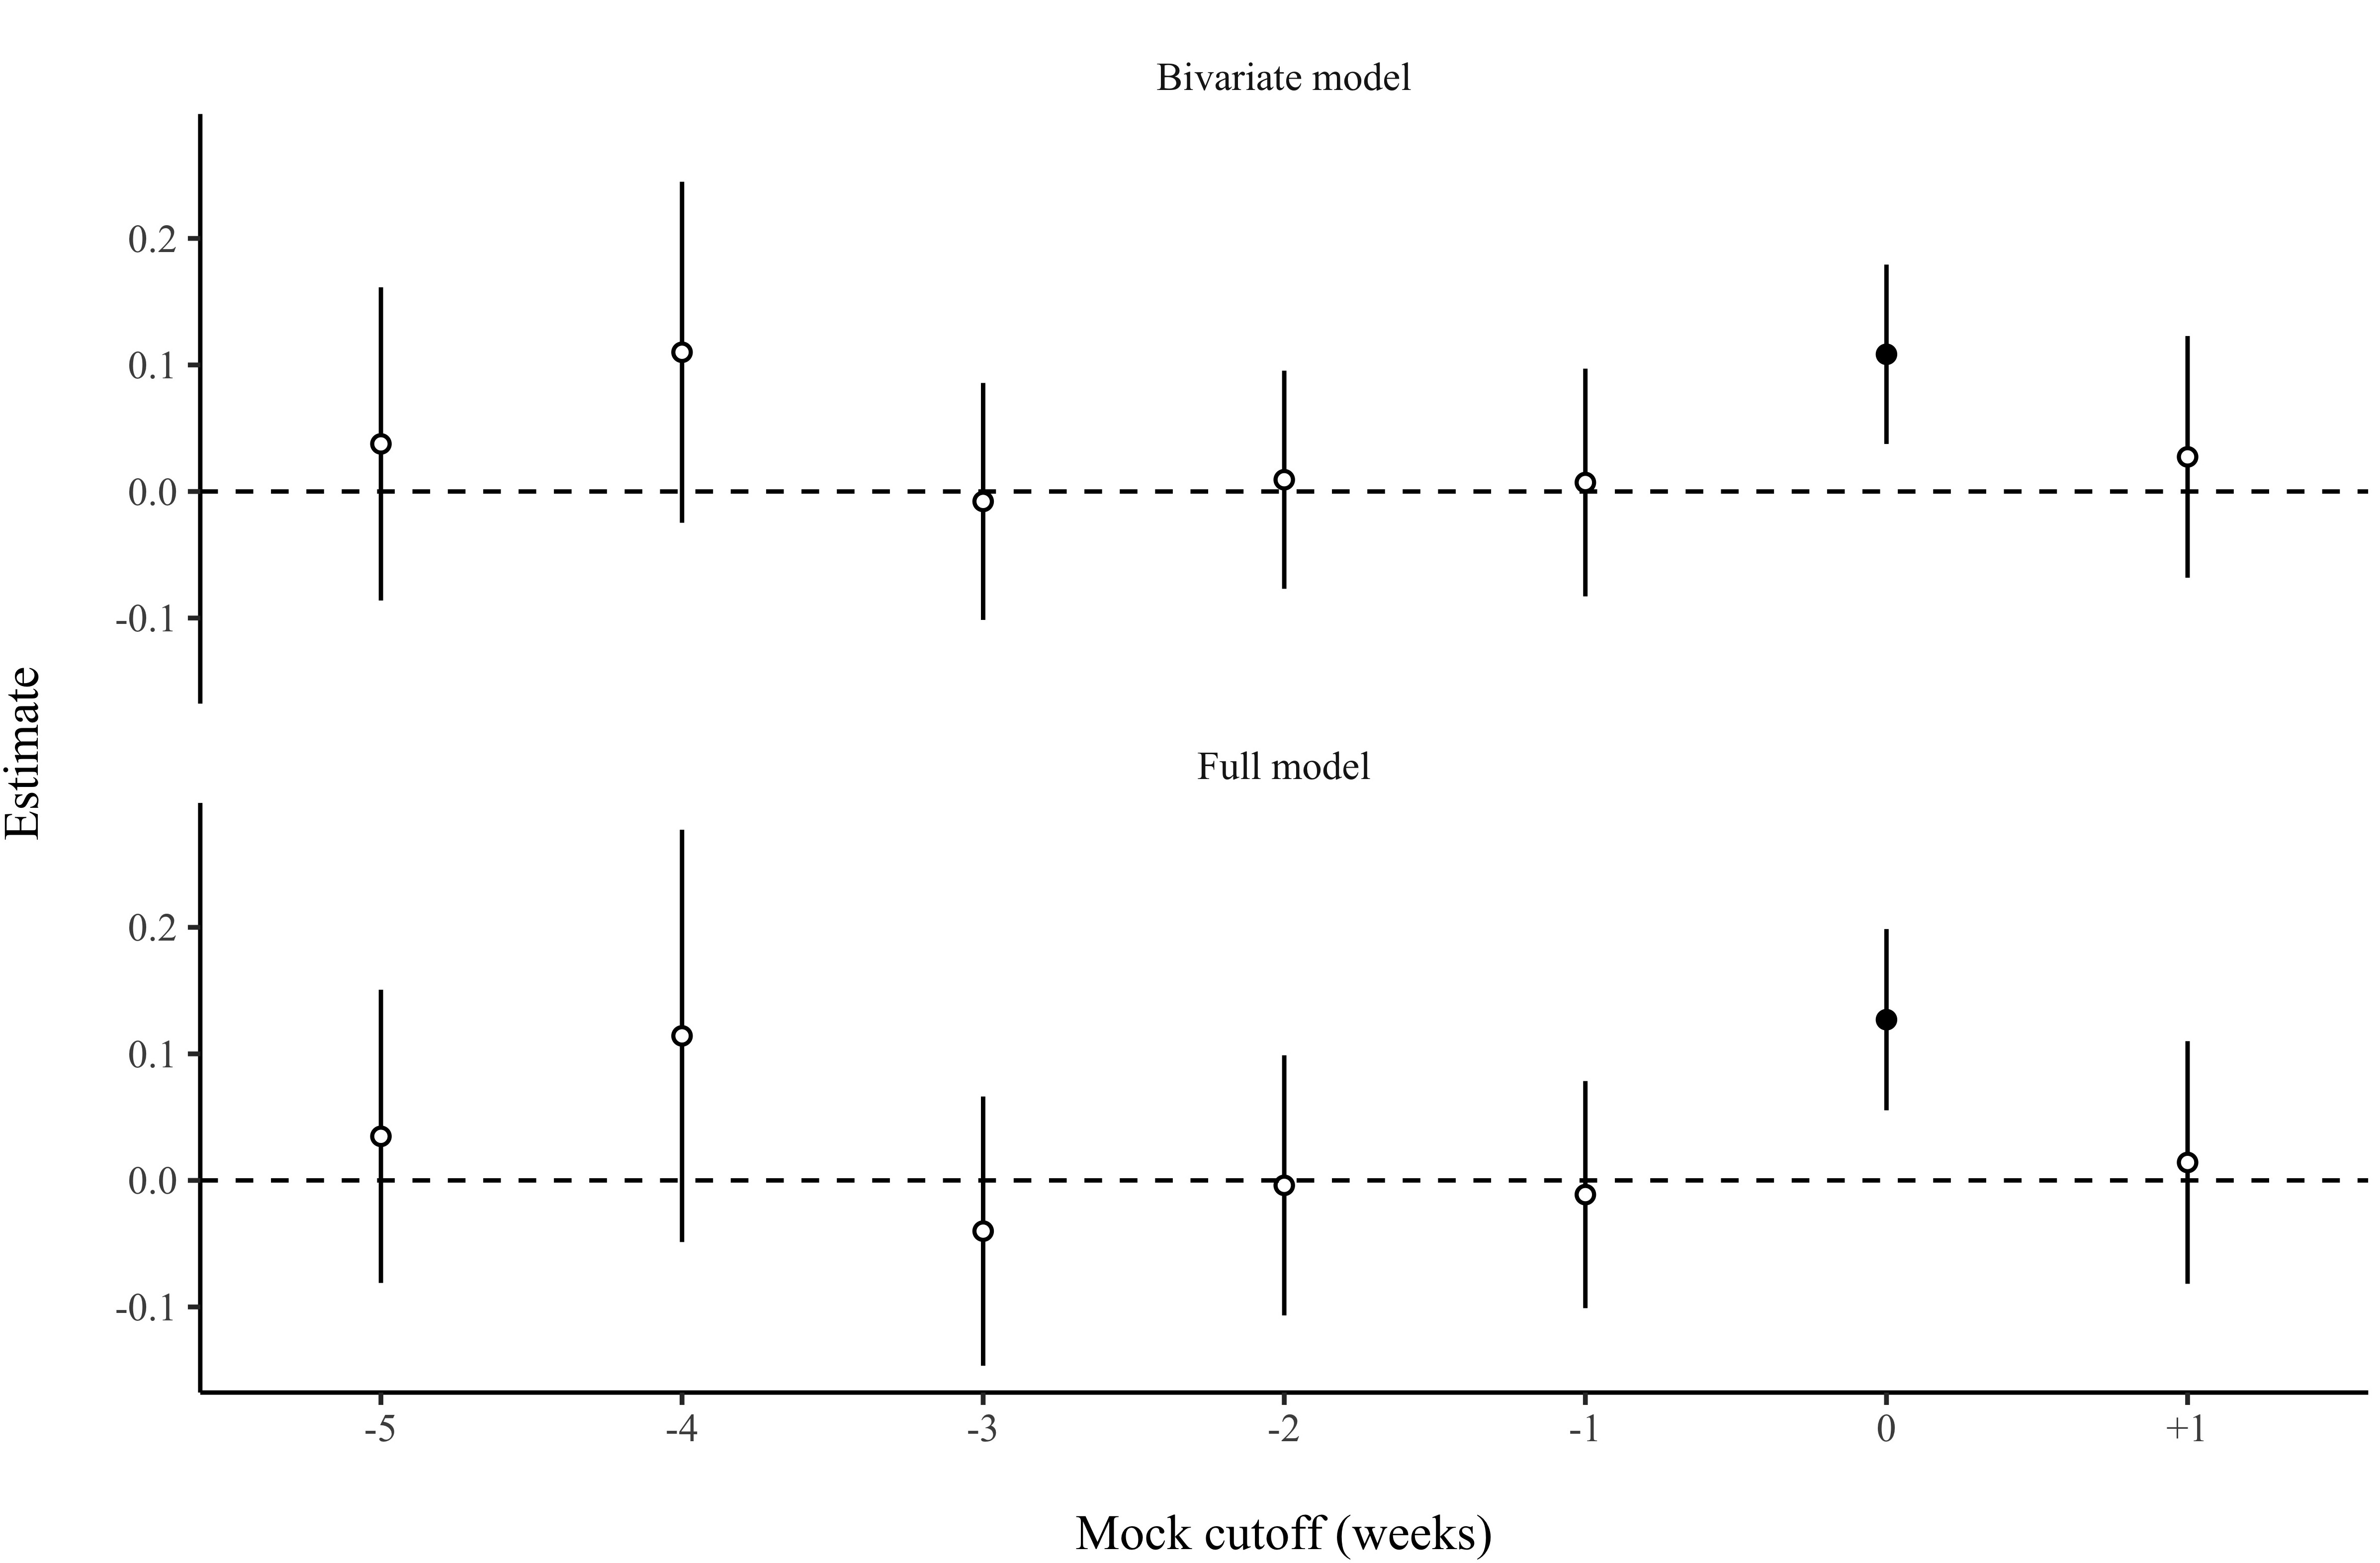
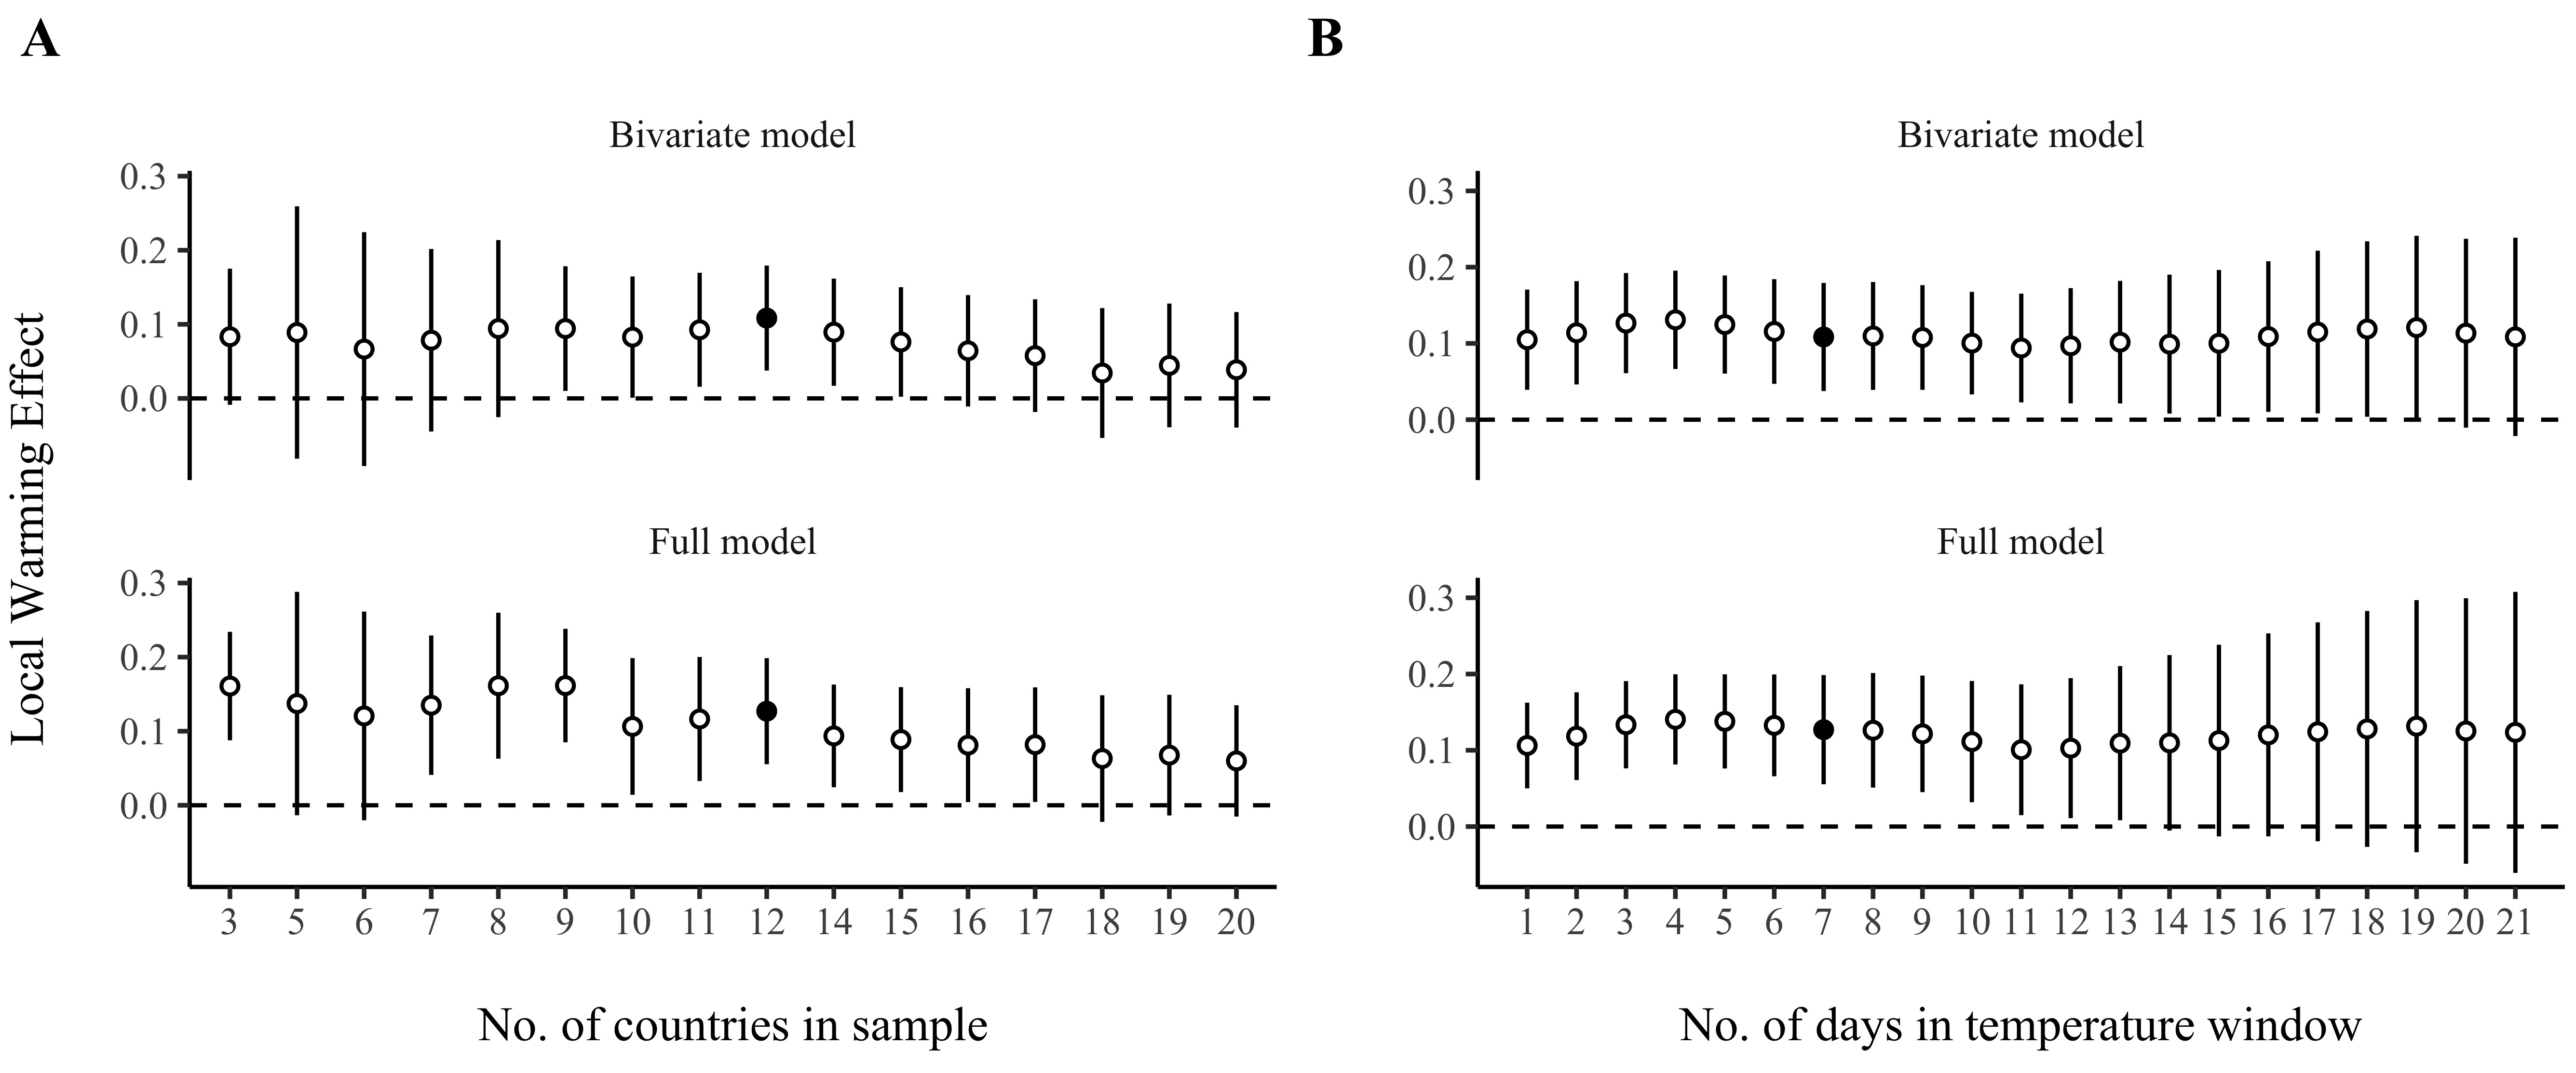
Robustness checks
Changing the sample size or 7-day temperature window
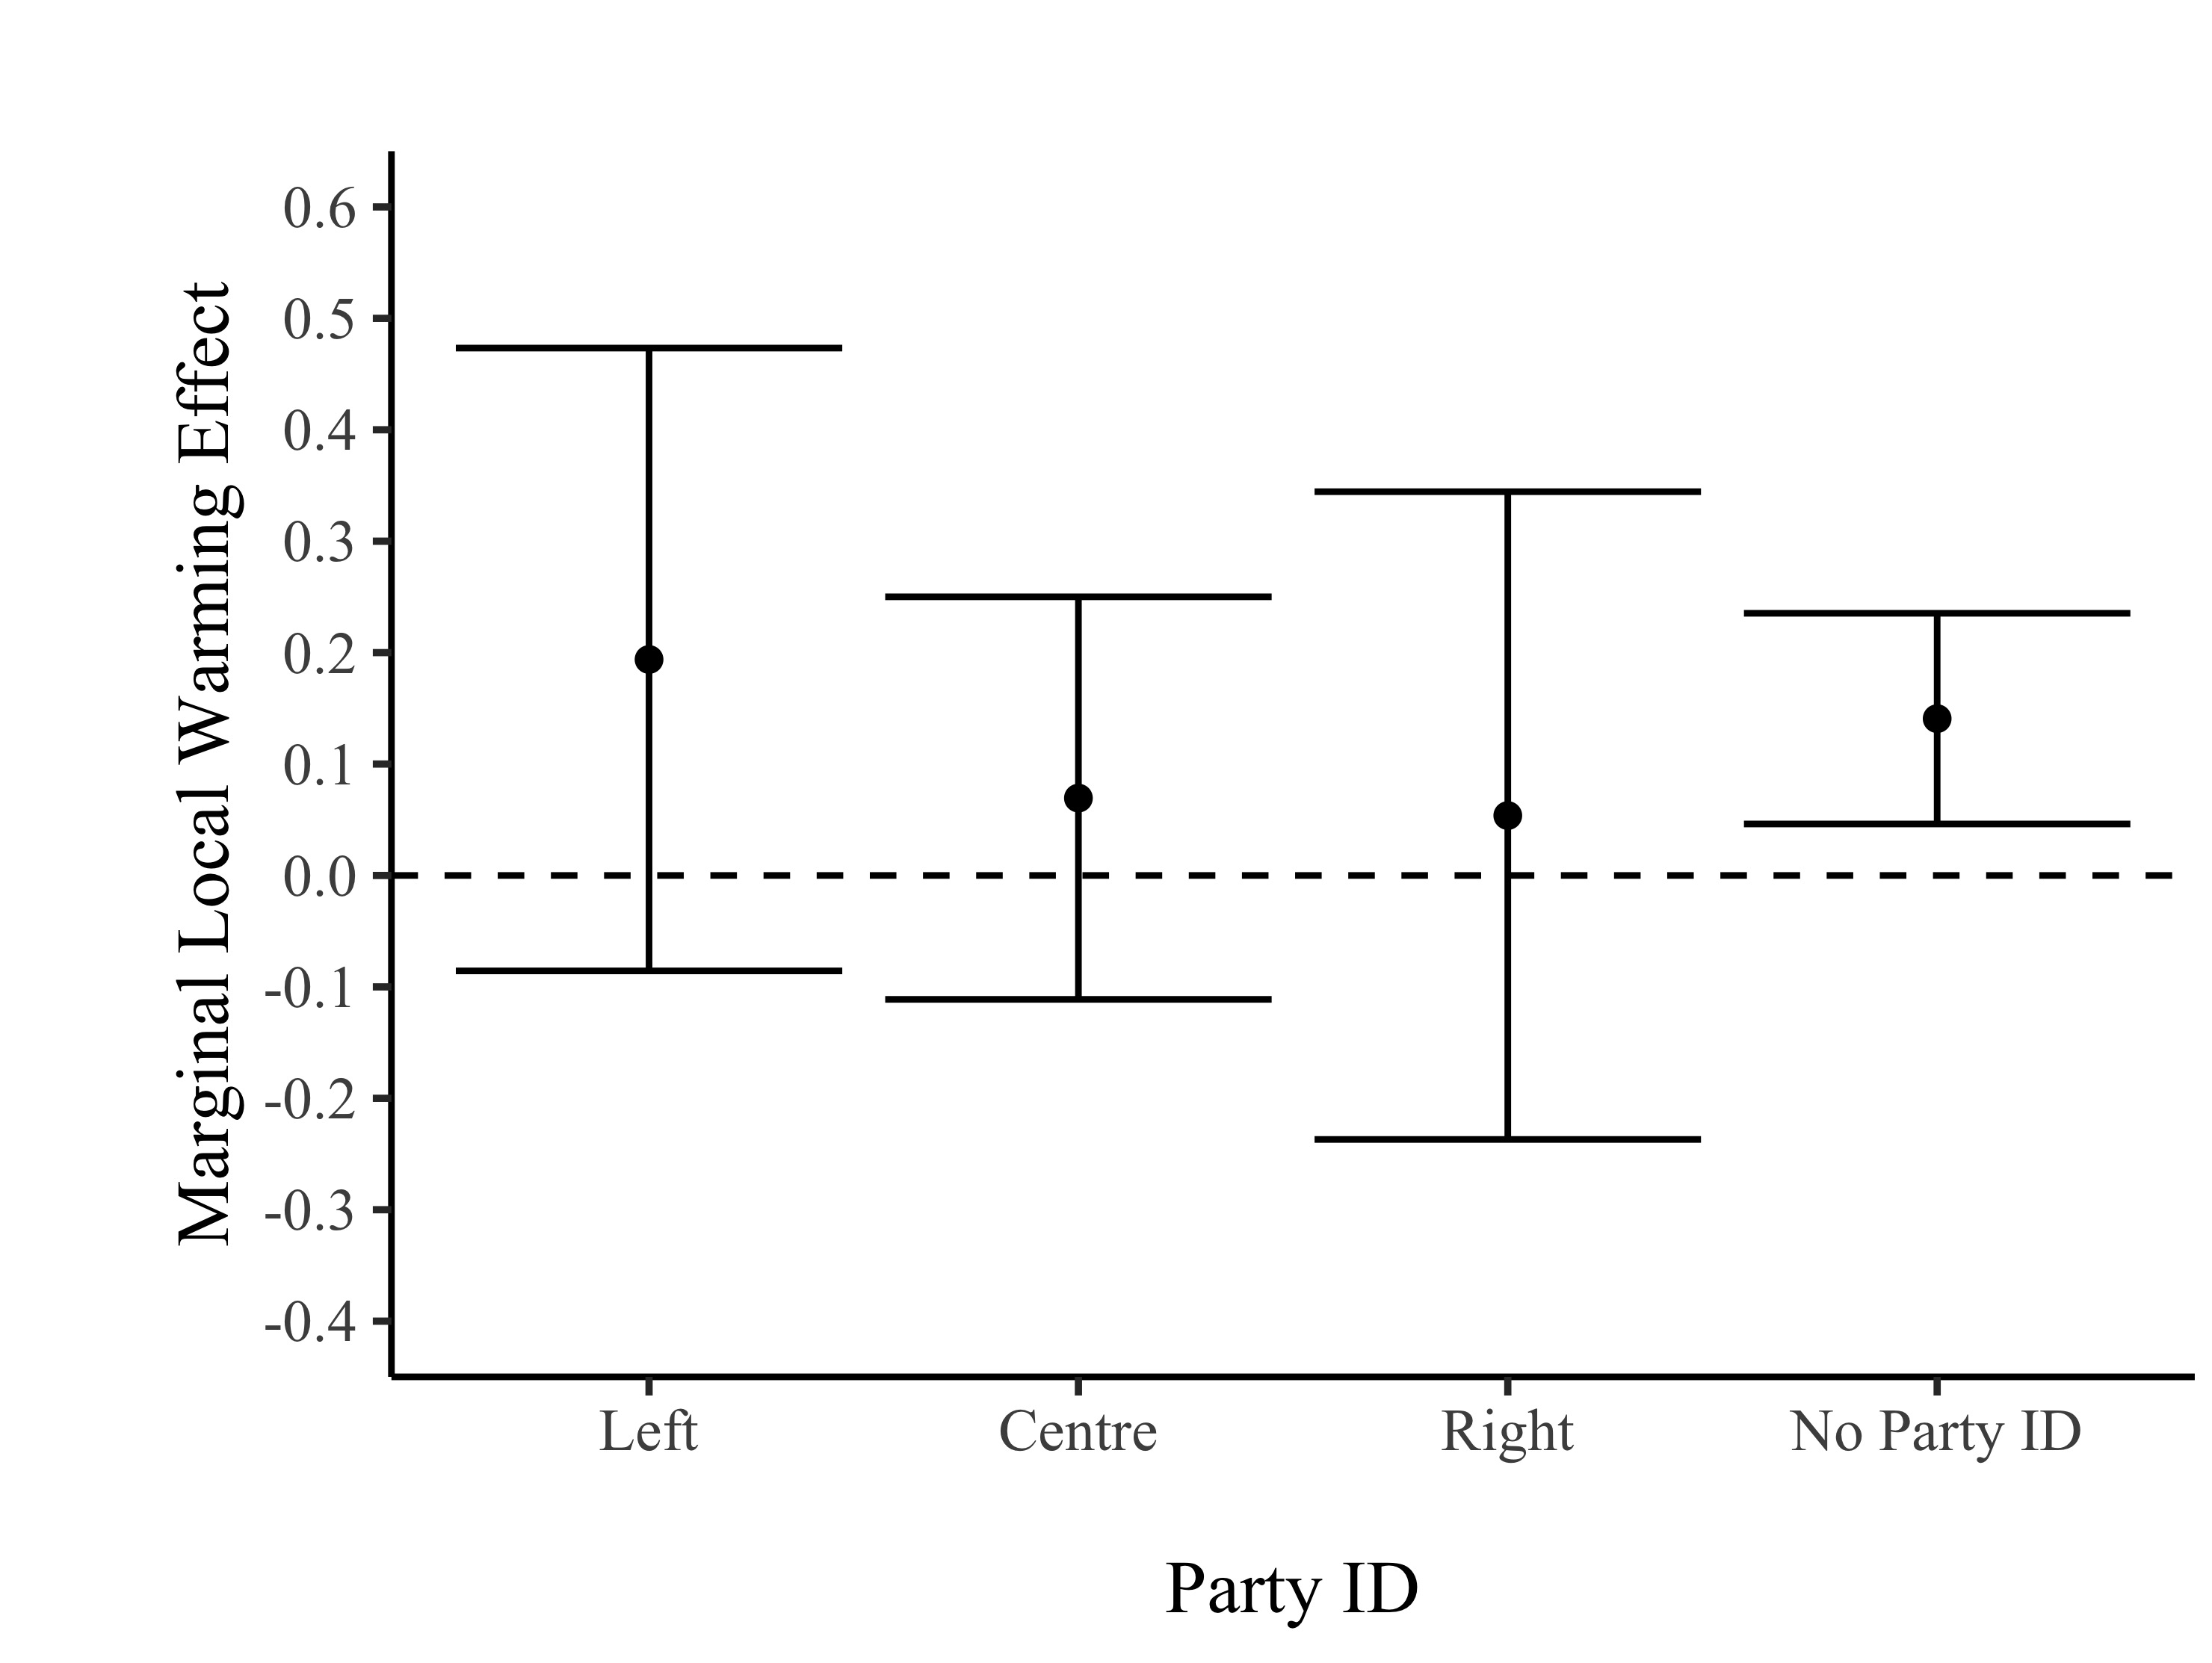
Left-right party ID
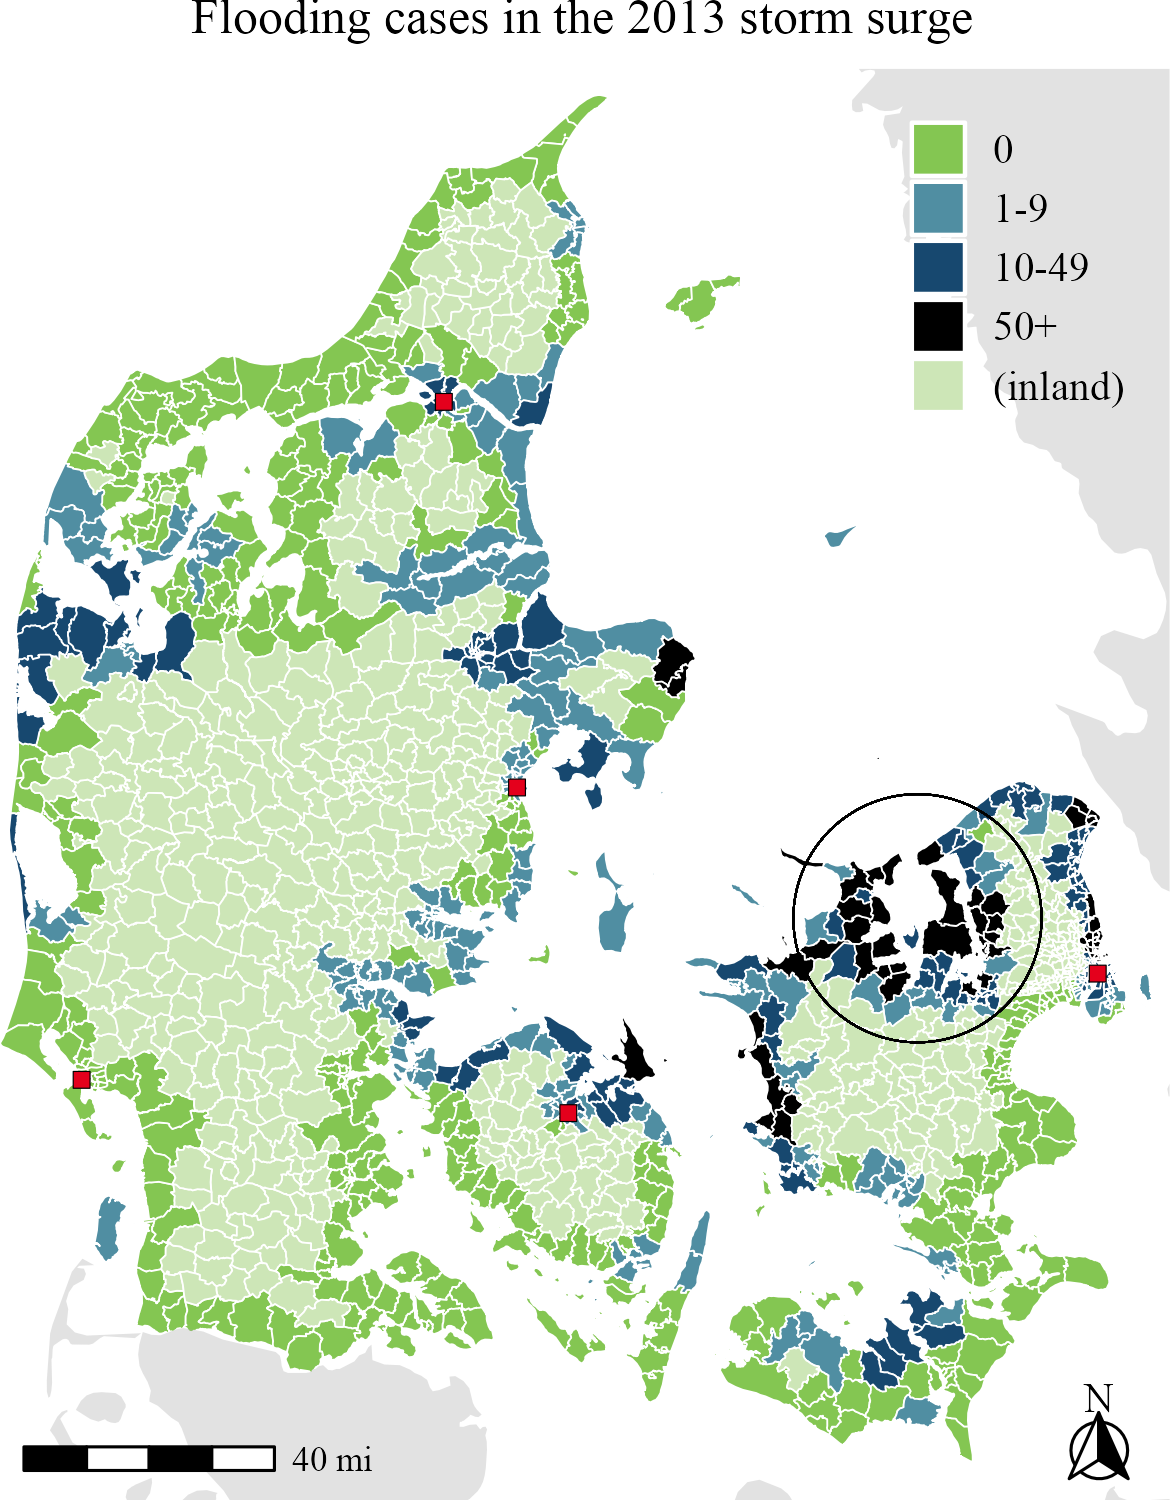
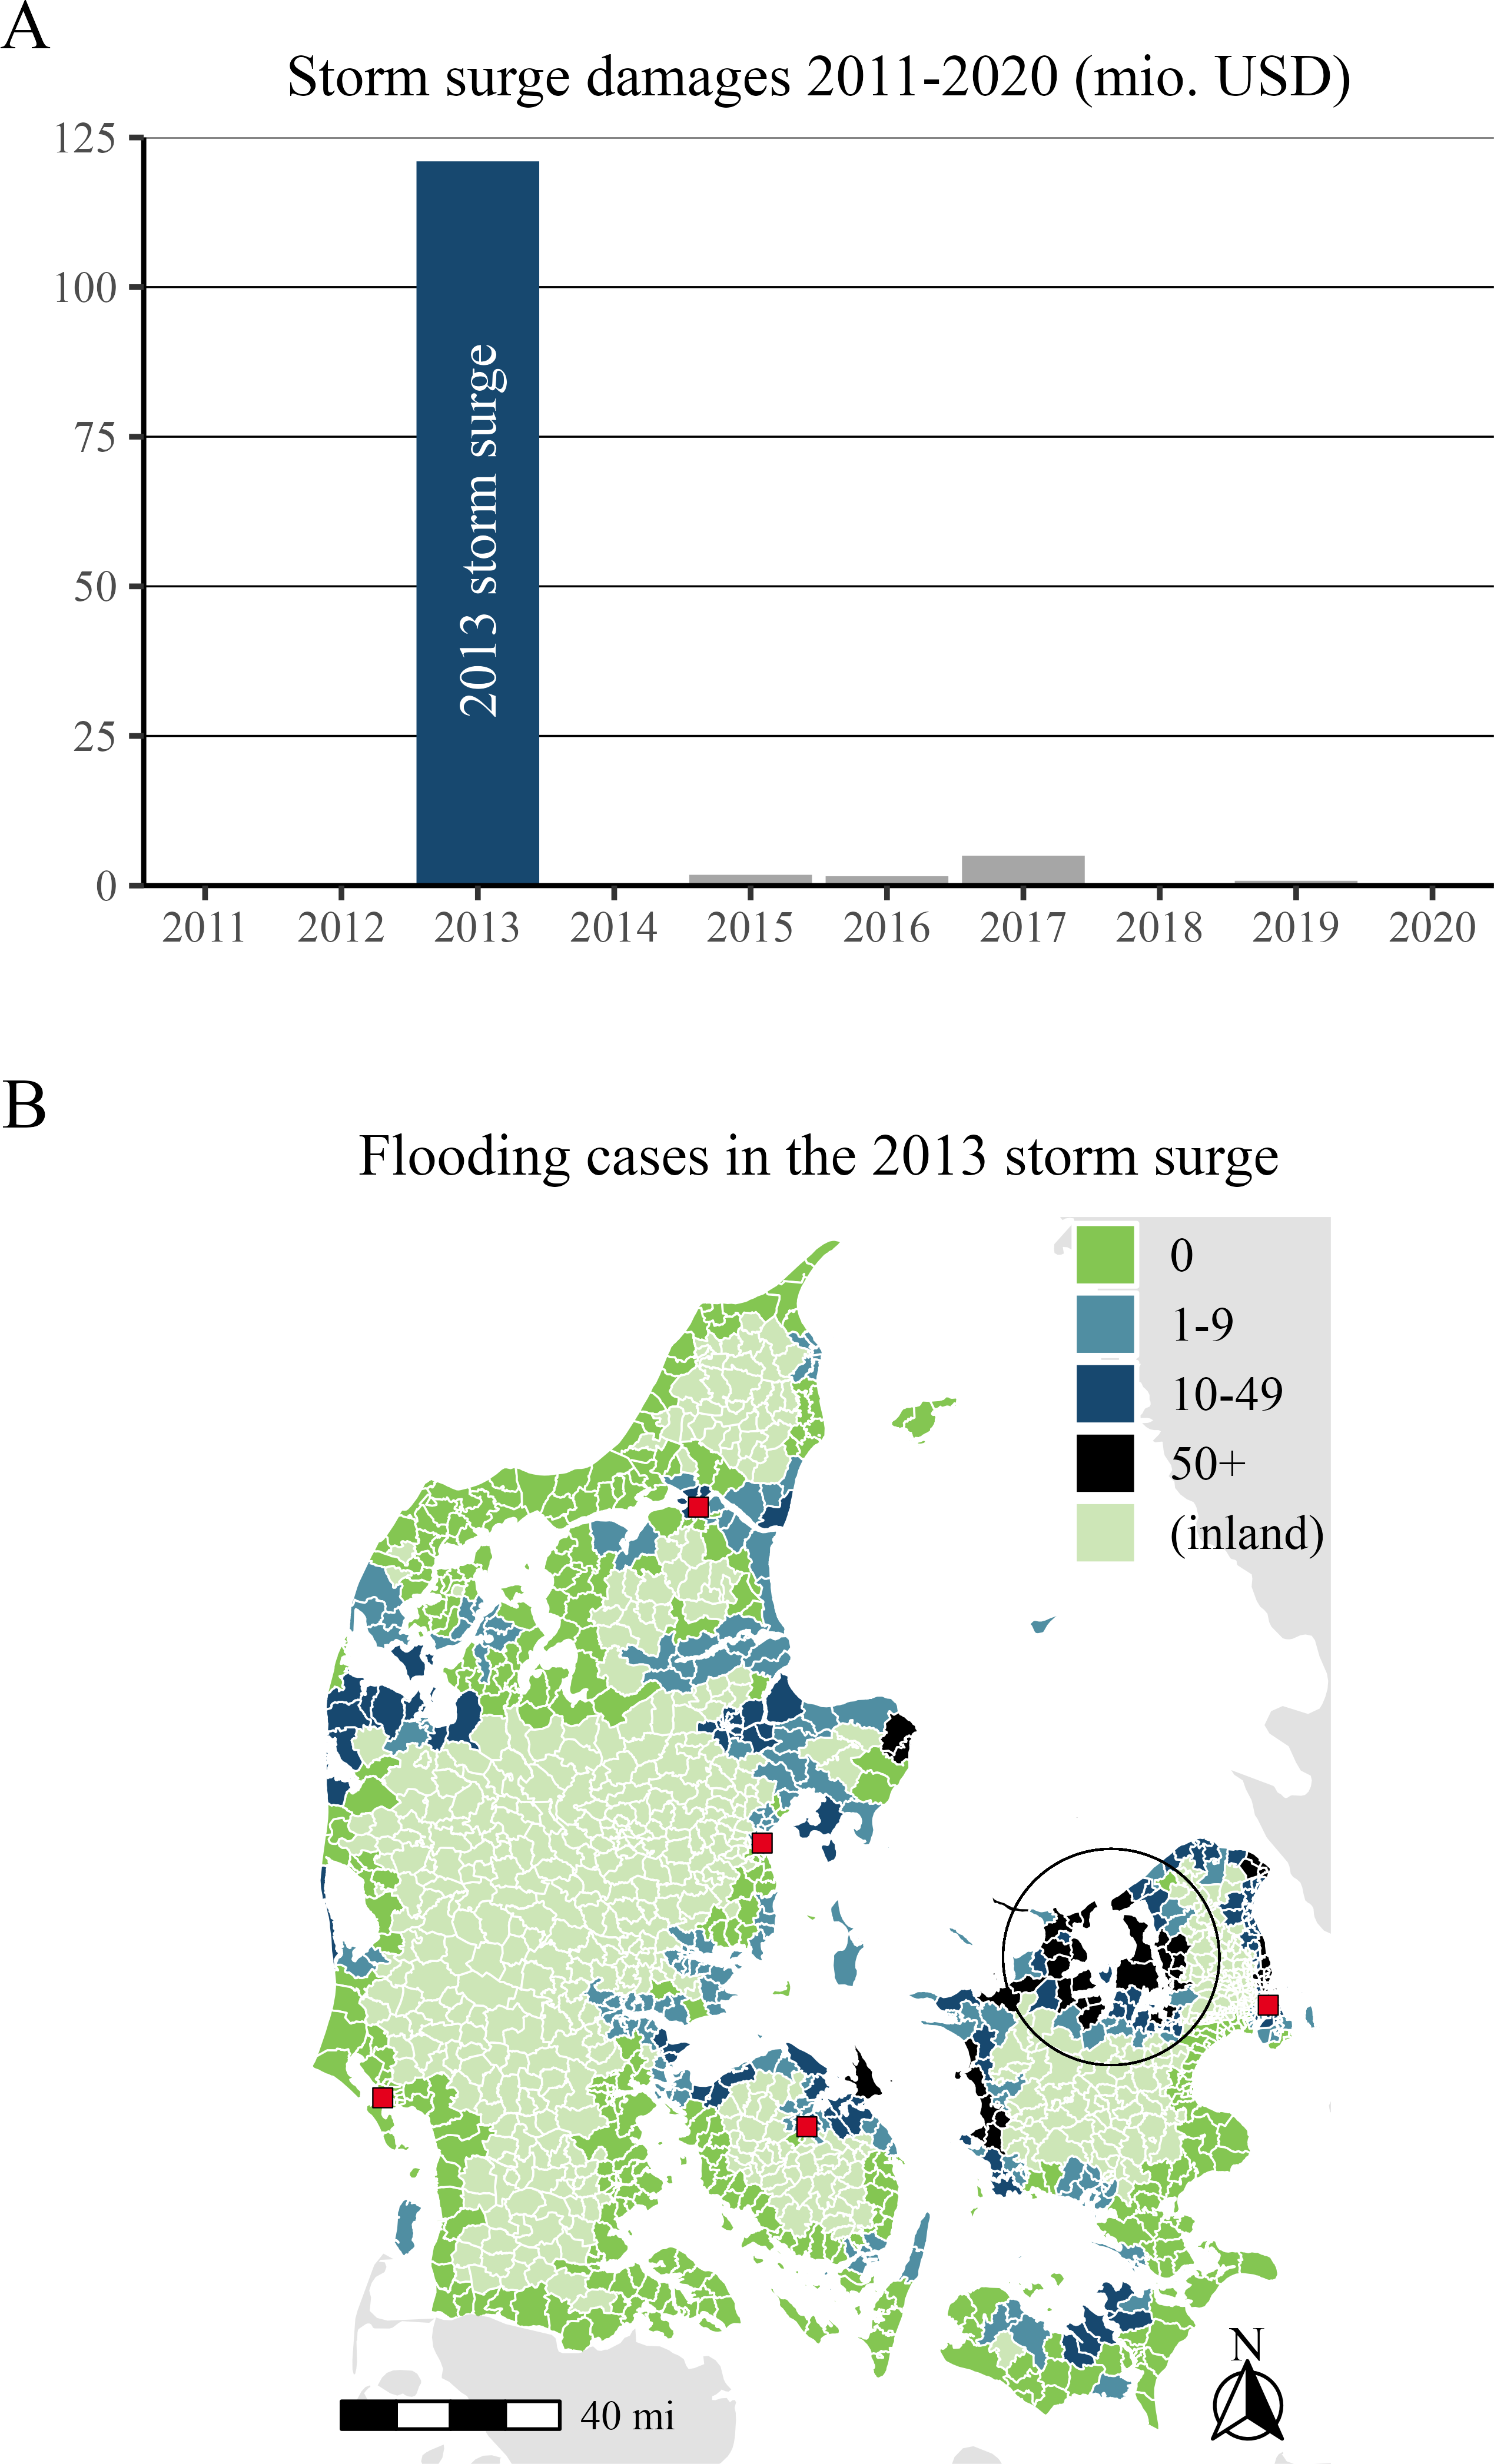
Storm surge timeline and map
Climate issue ownership
Balance
<Coefficient plot in Section 4.6>
Event study plot
Pro-climate parties
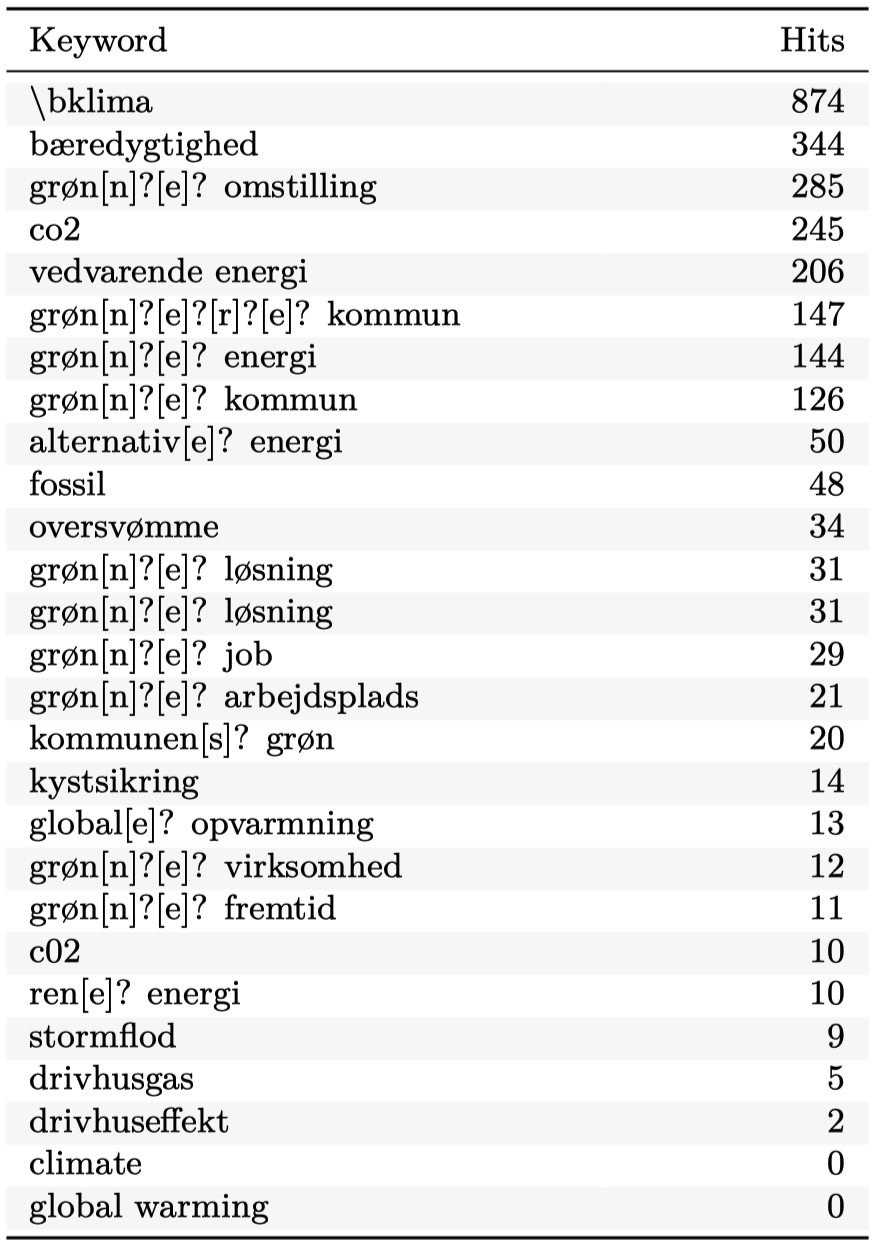
Climate candidate keywords
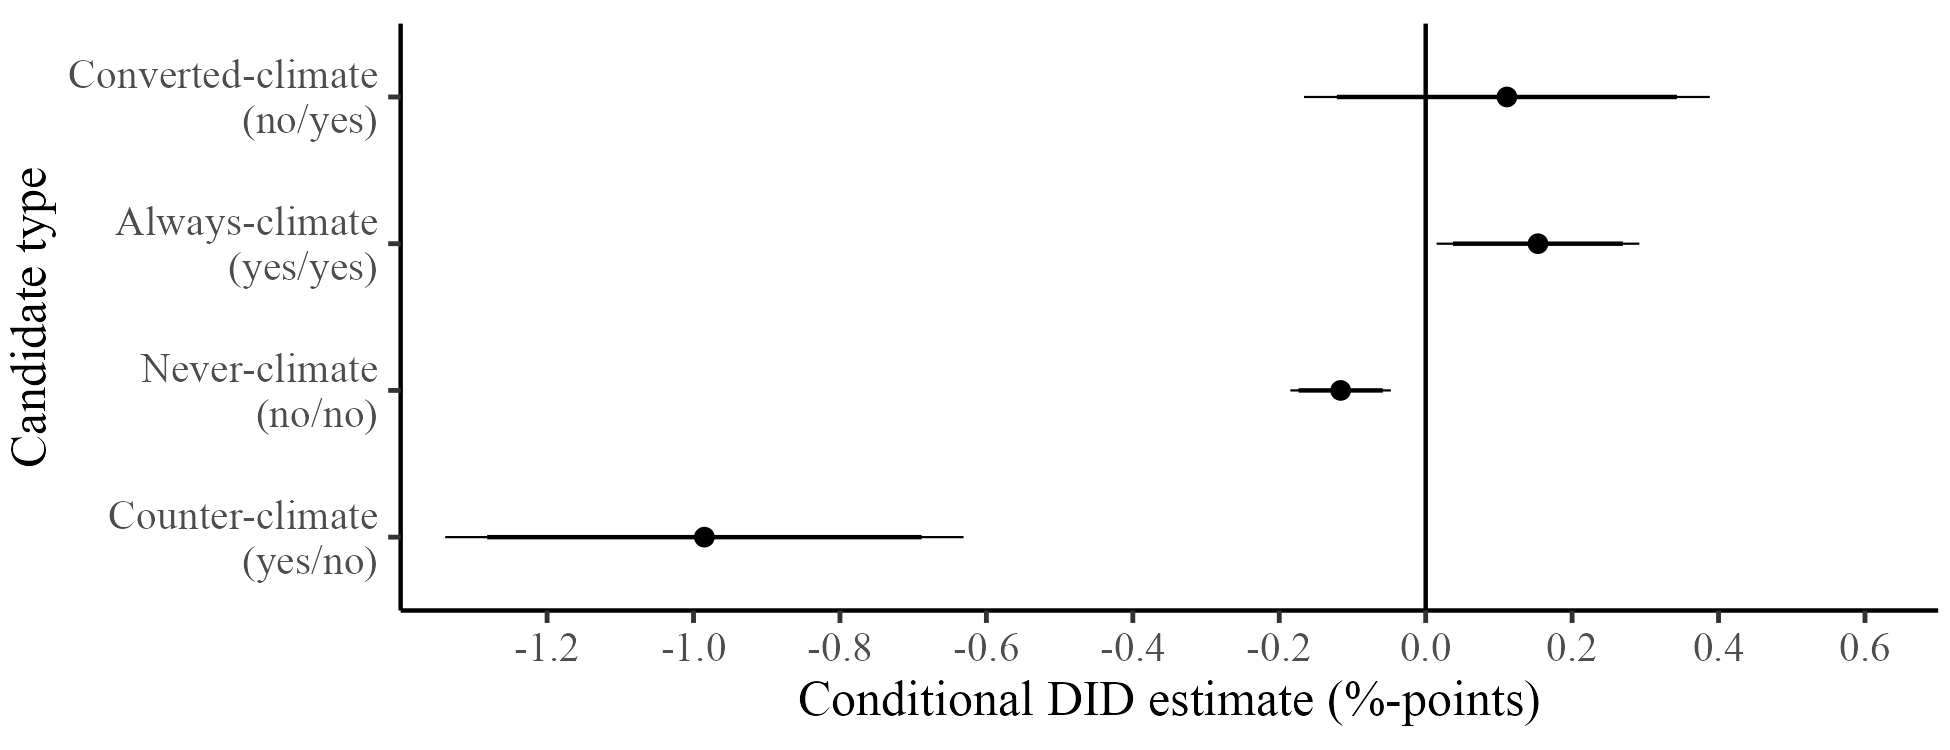
Candidates becoming pro-climate?
Sample: 2,077 candidates running in both elections
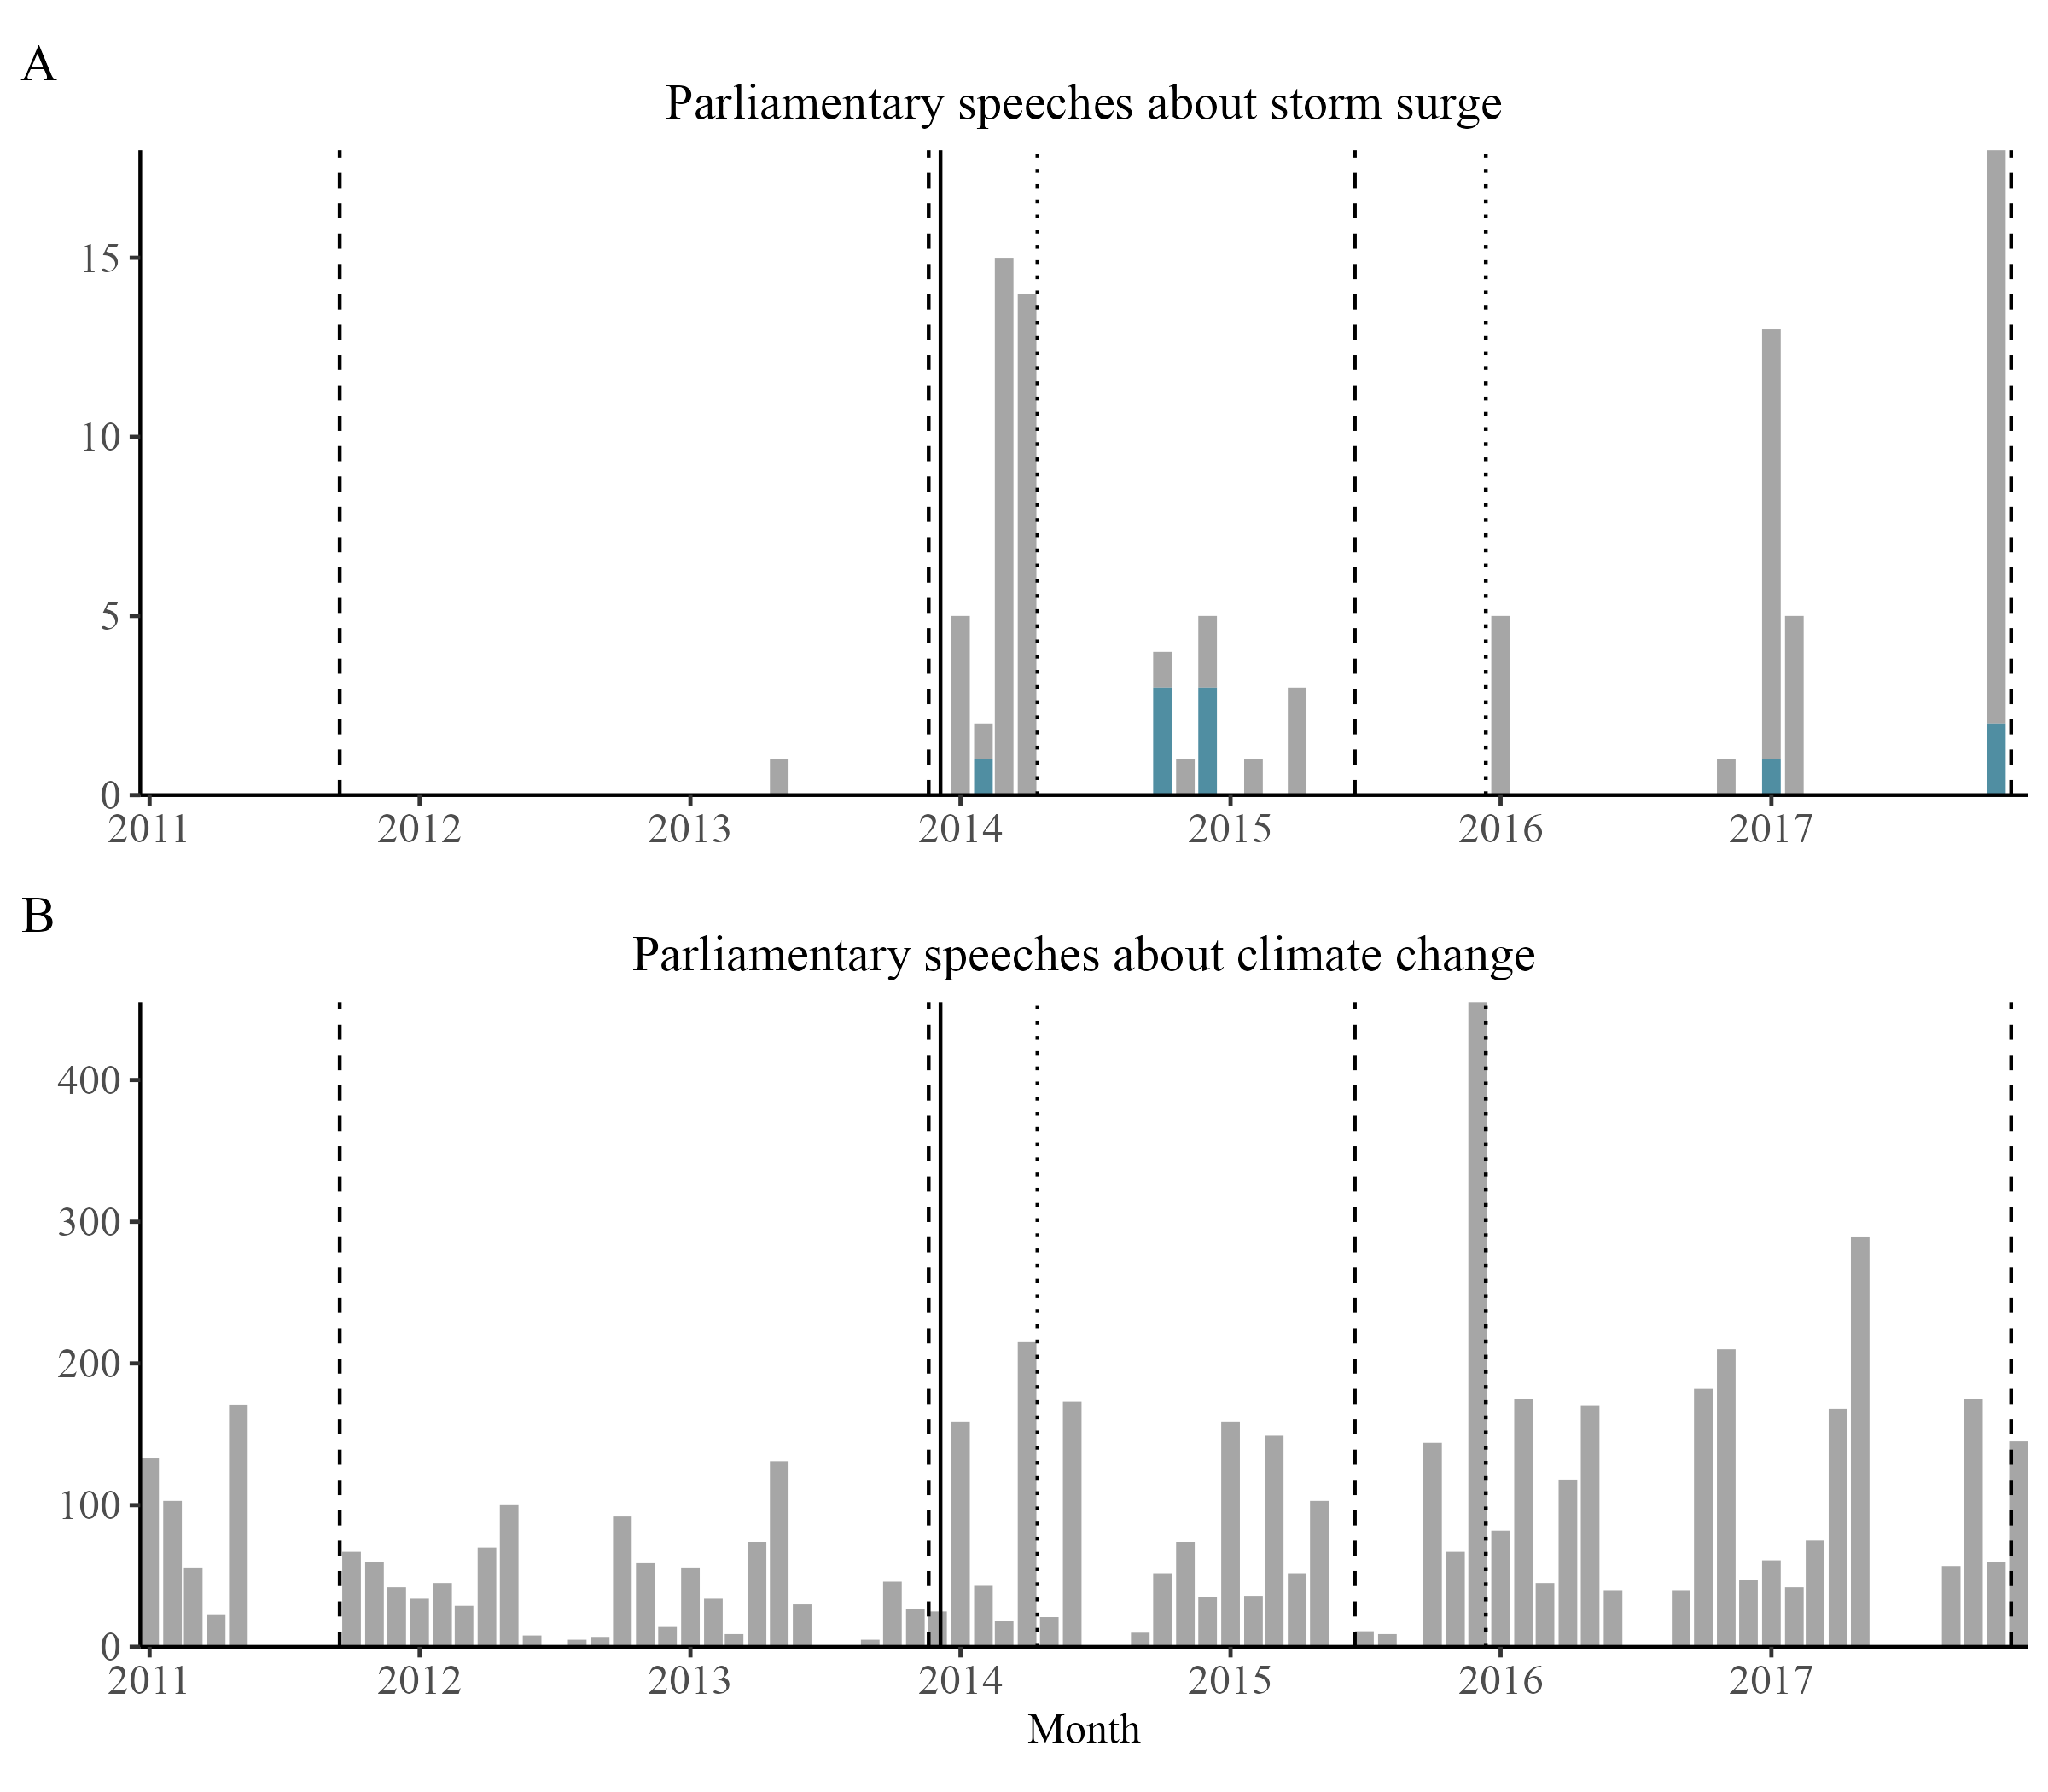
Parliamentary speeches
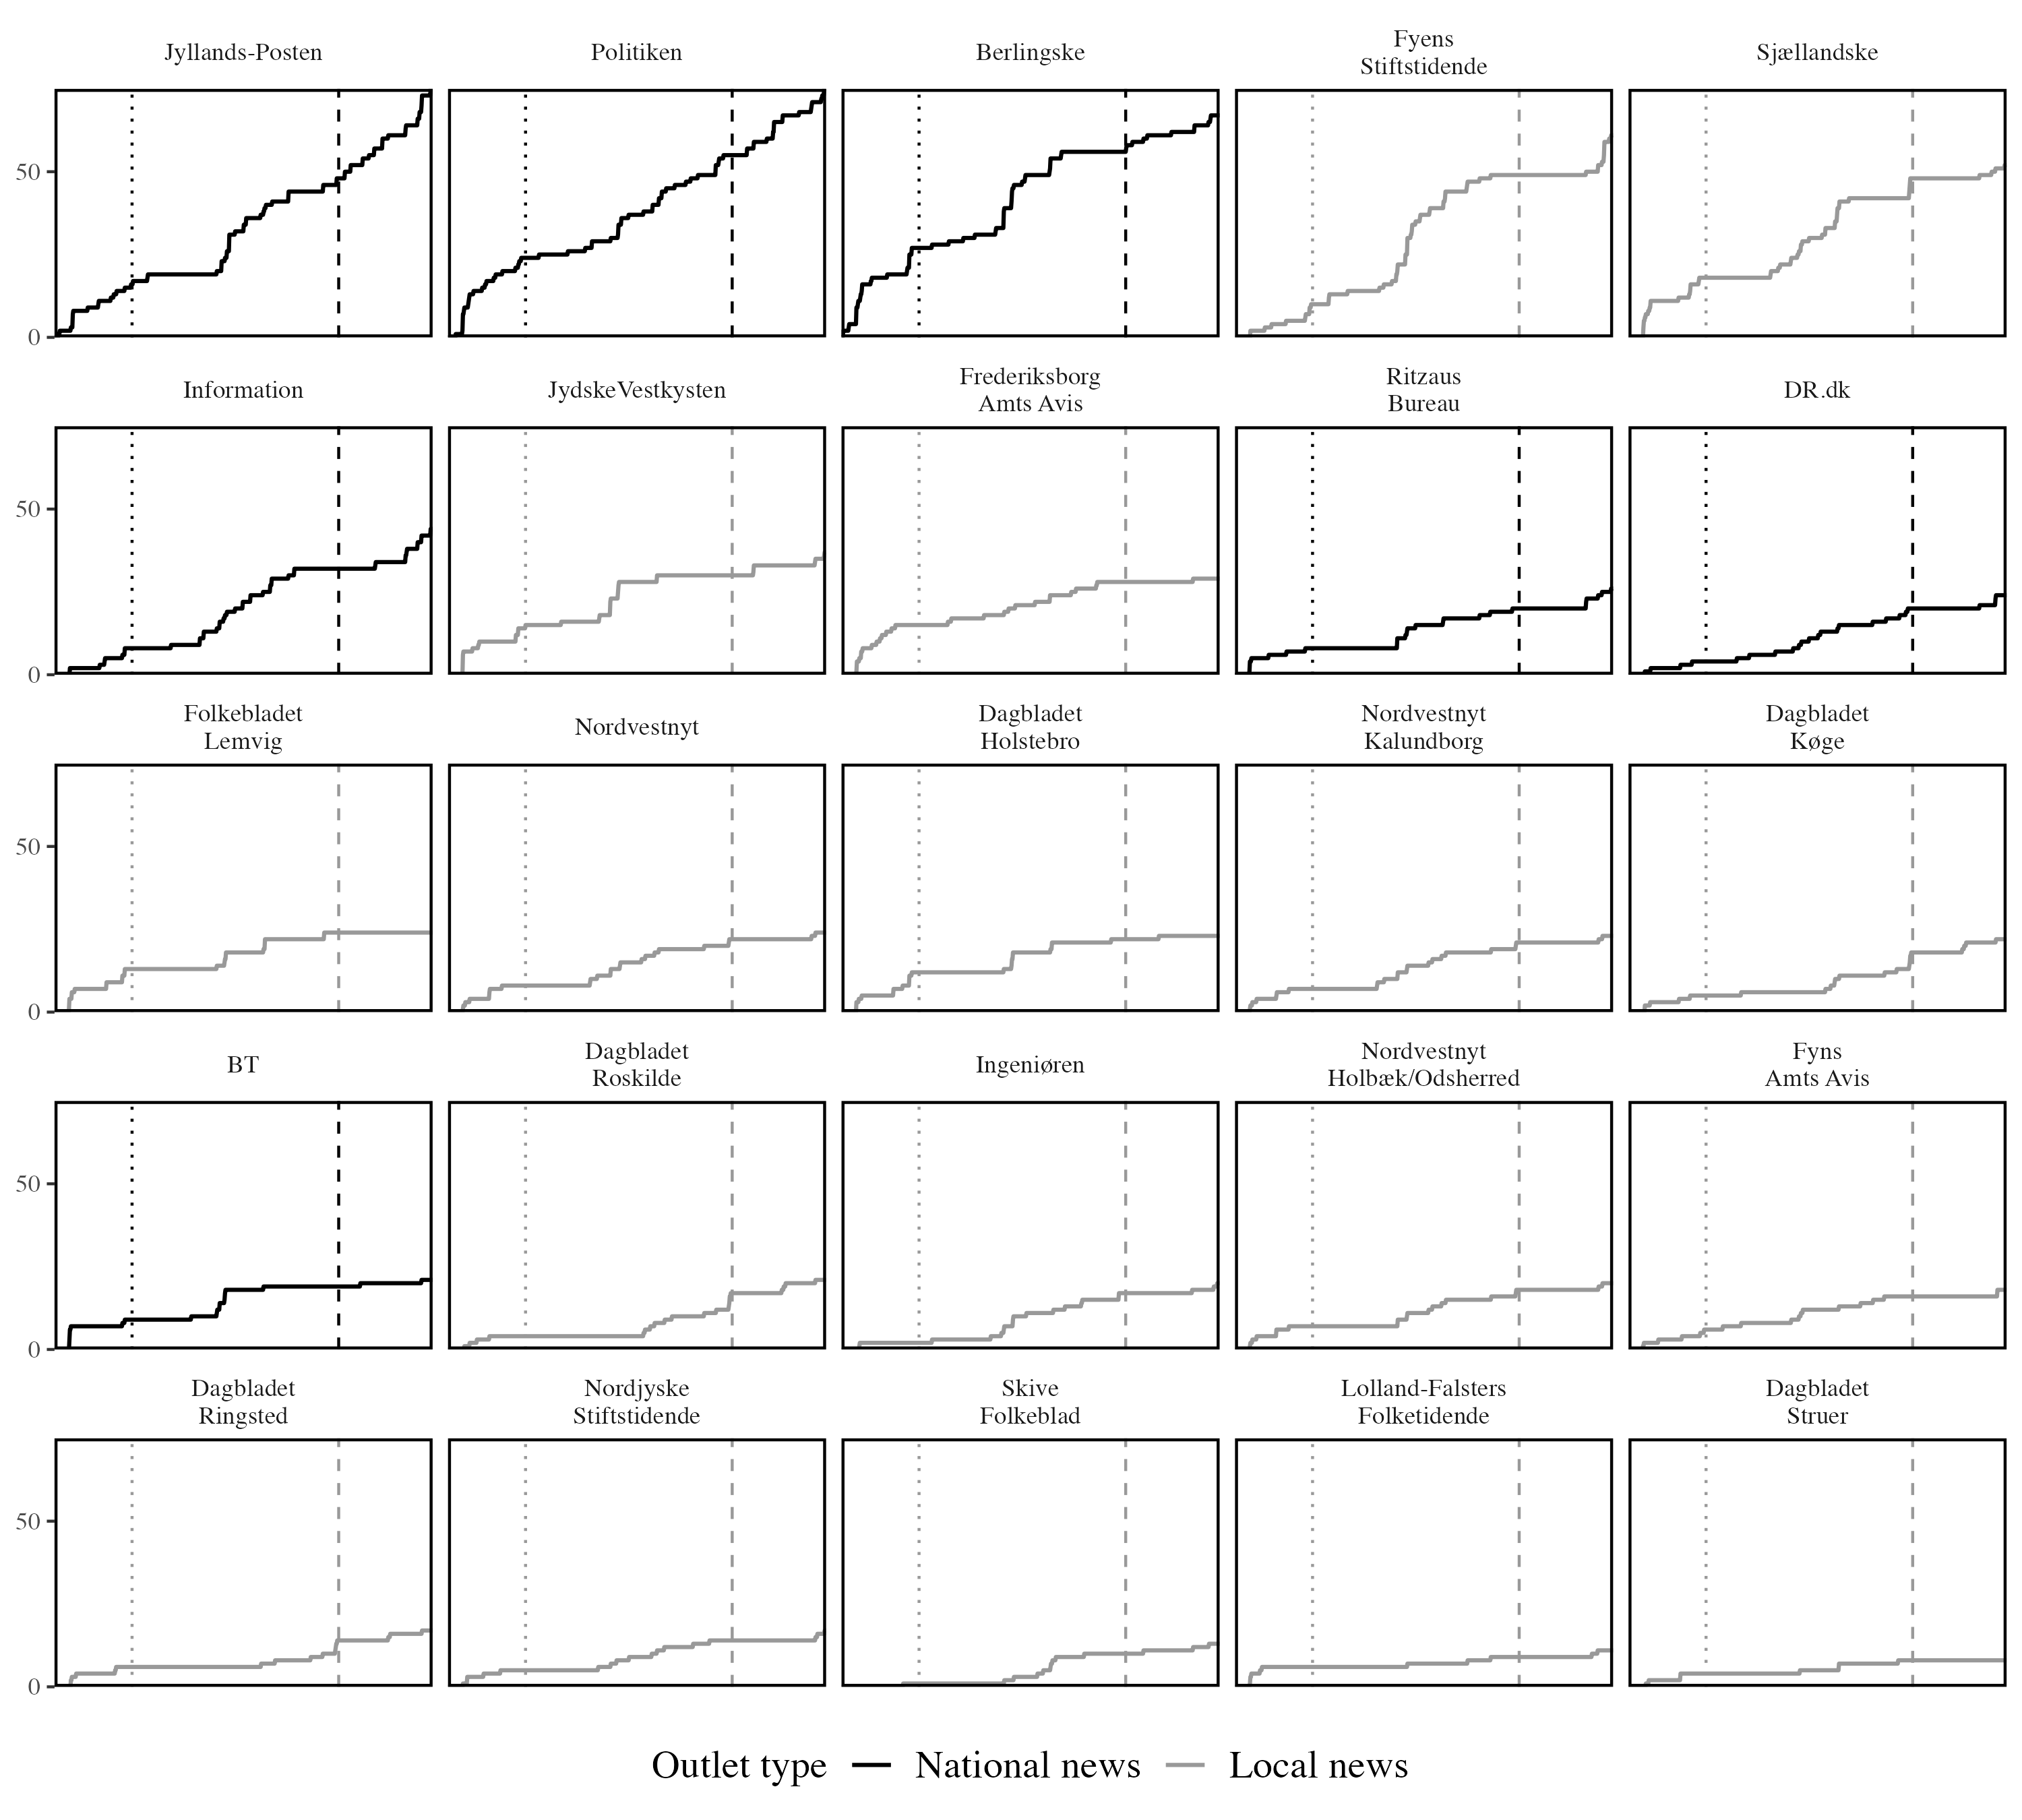
Media coverage
Covariate balance: age, distance, and density
Non-linear weather effects