Paper presentation of “Personalized risk messaging can reduce climate concerns”

Survey Methodology course

Søren Damsbo-Svendsen

PhD fellow
Department of Political Science
University of Copenhagen

May 11, 2023

Personalized risk messaging can reduce climate concerns

  • Simple, original survey experiment on climate communication
  • Authors:
    • Matto Mildenberger
    • Mark Lubell
    • Michelle Hummel
  • Published in Global Environmental Change in 2019
  • Climate opinion literature / political science

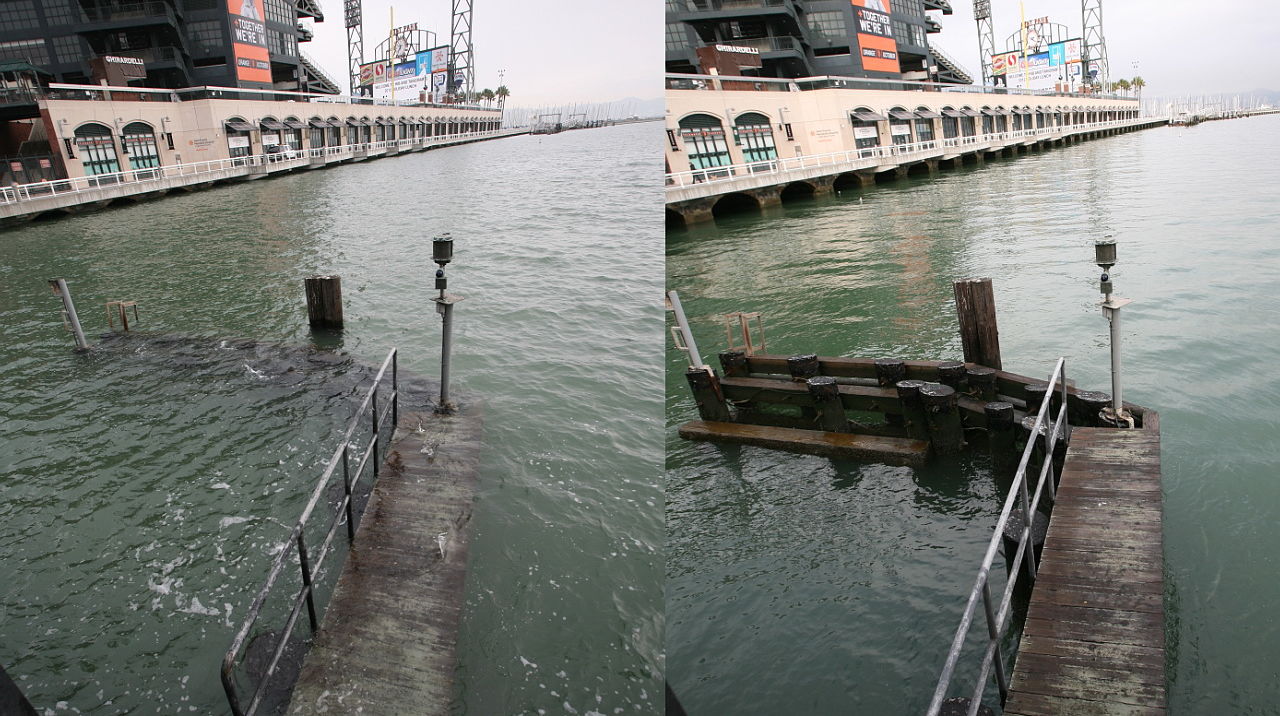
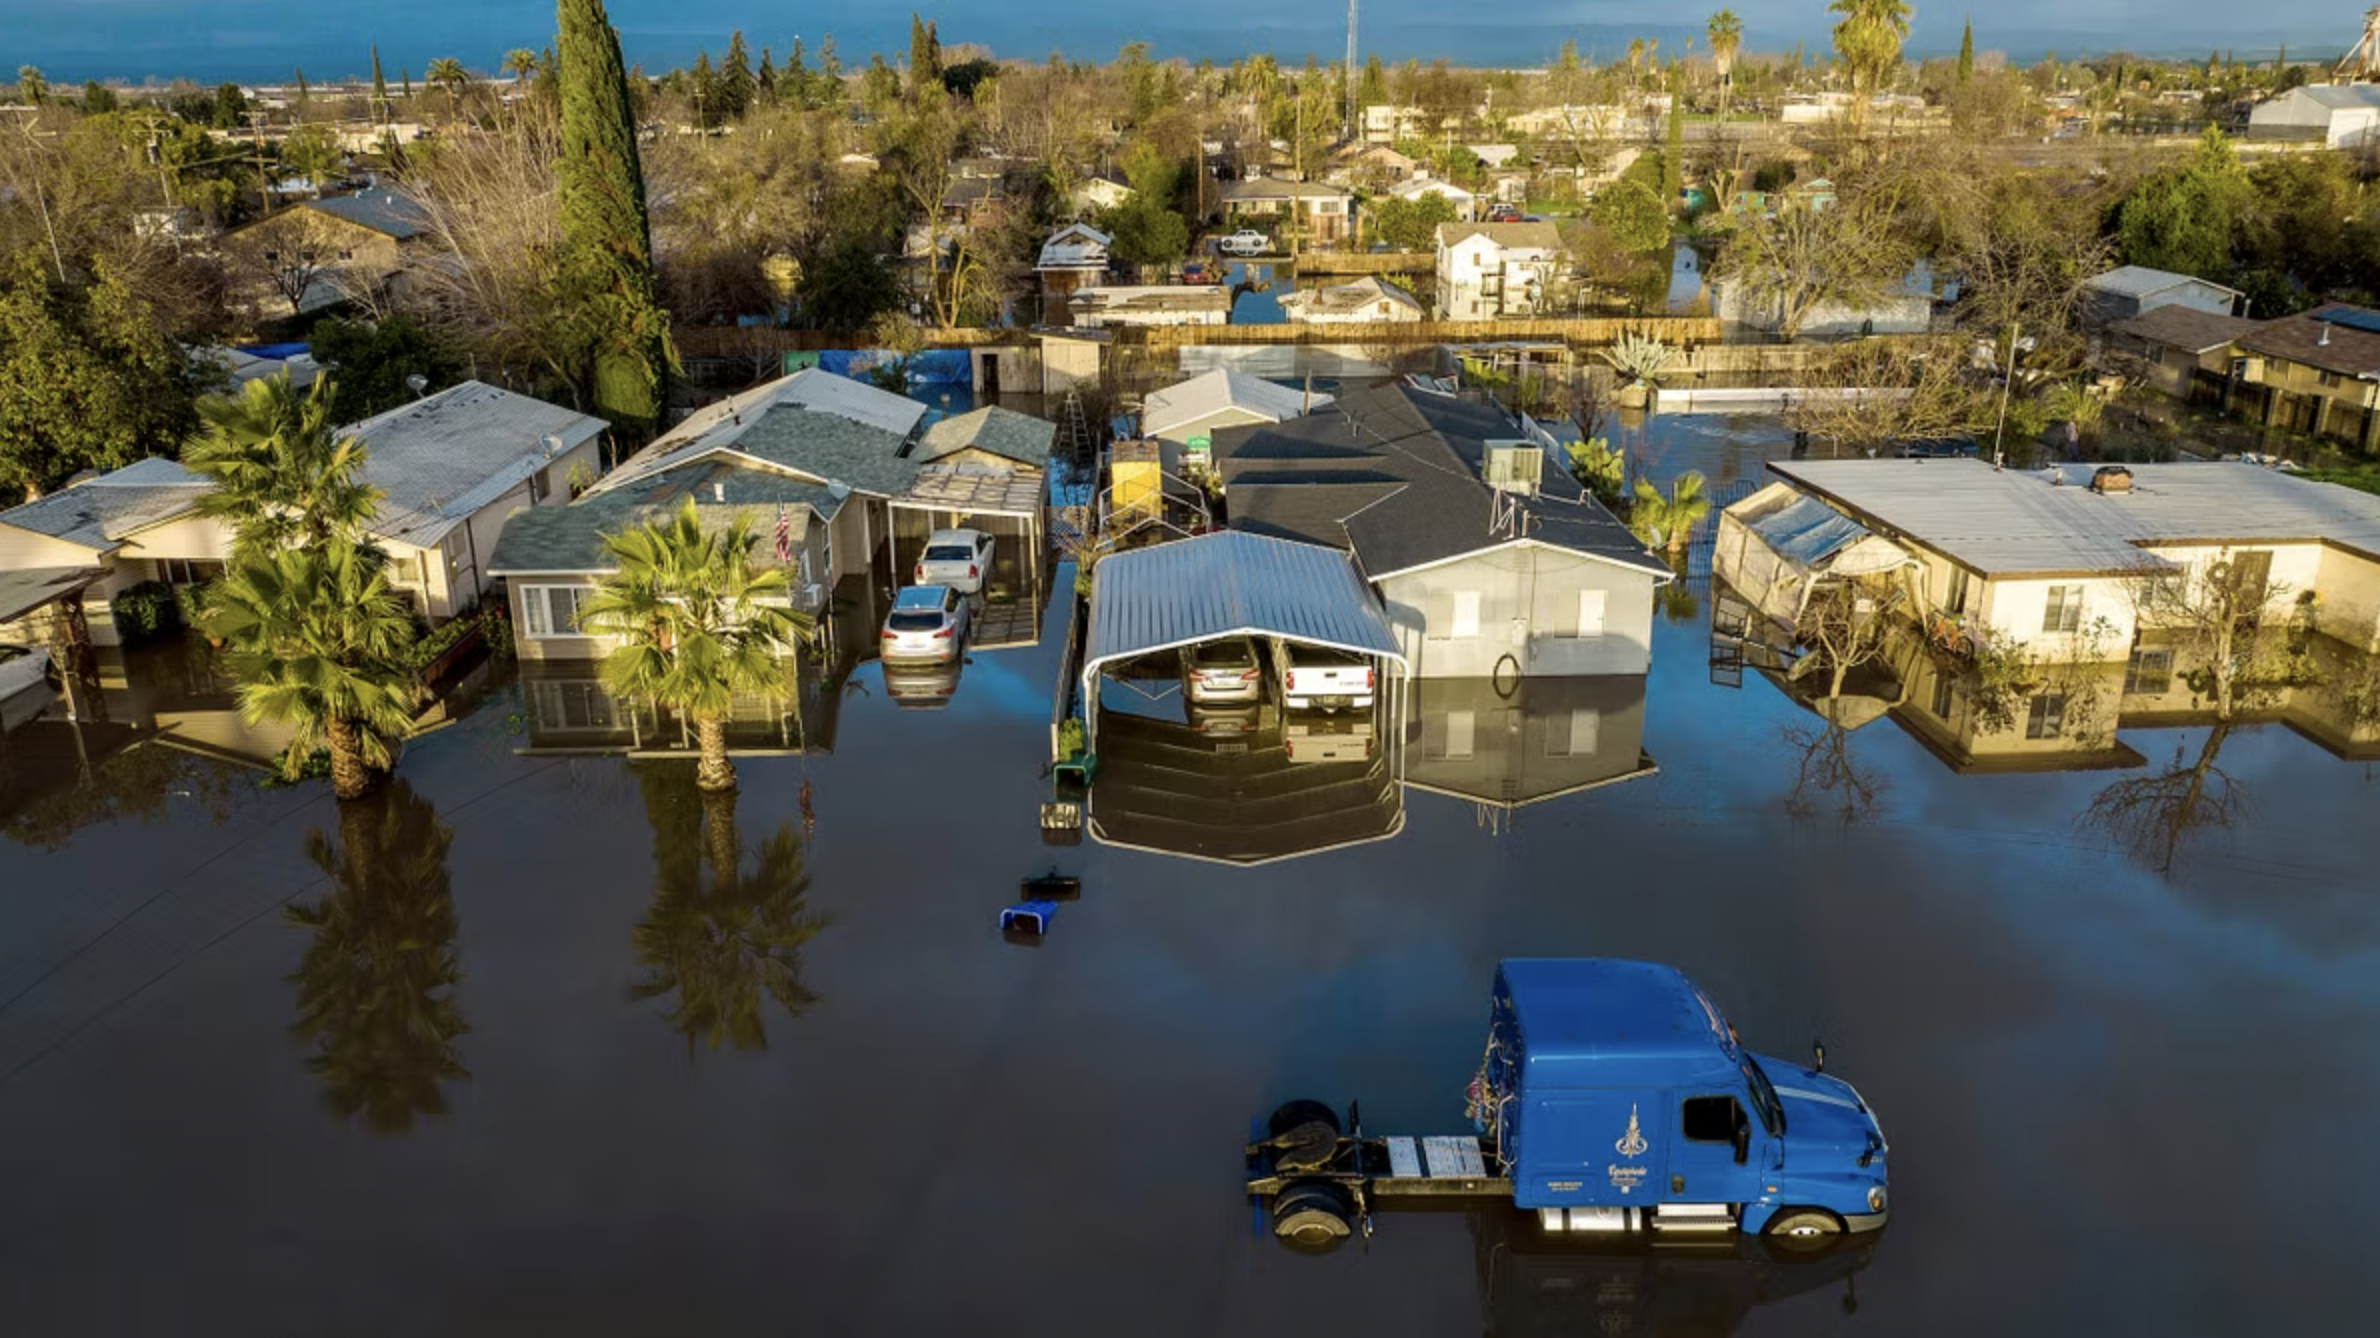
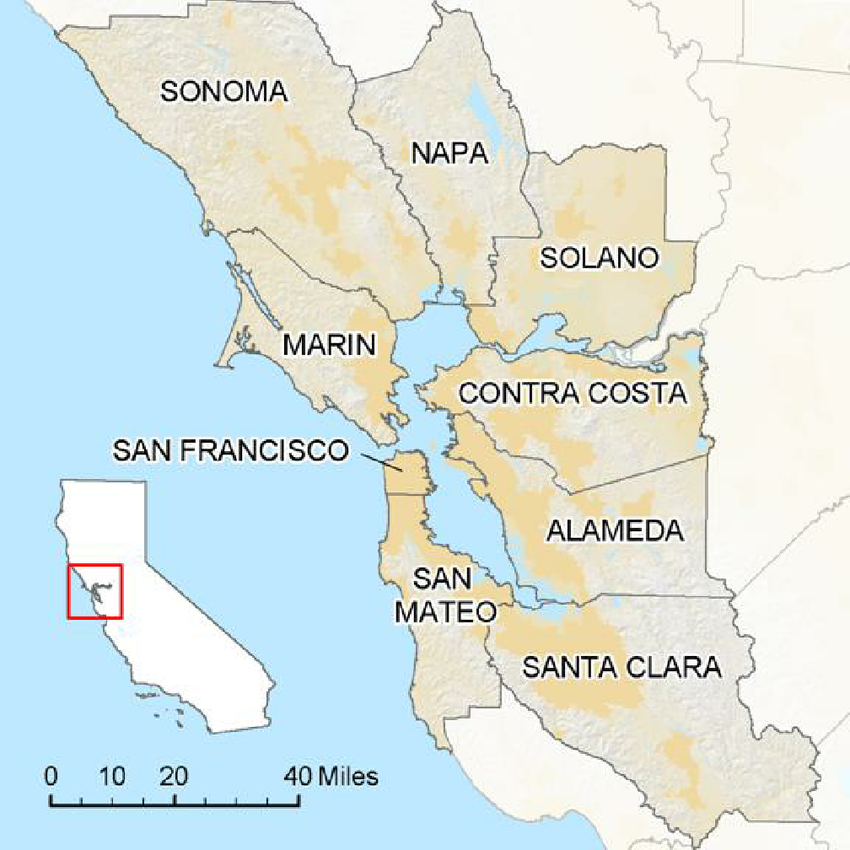
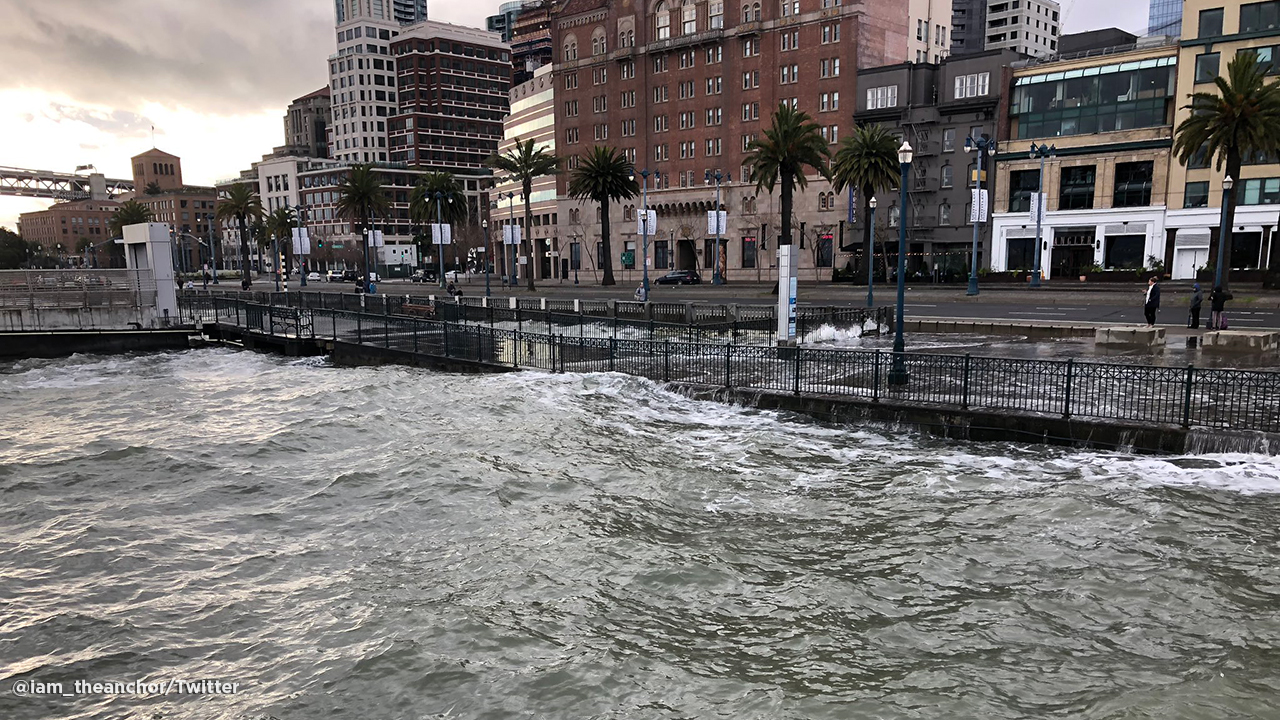
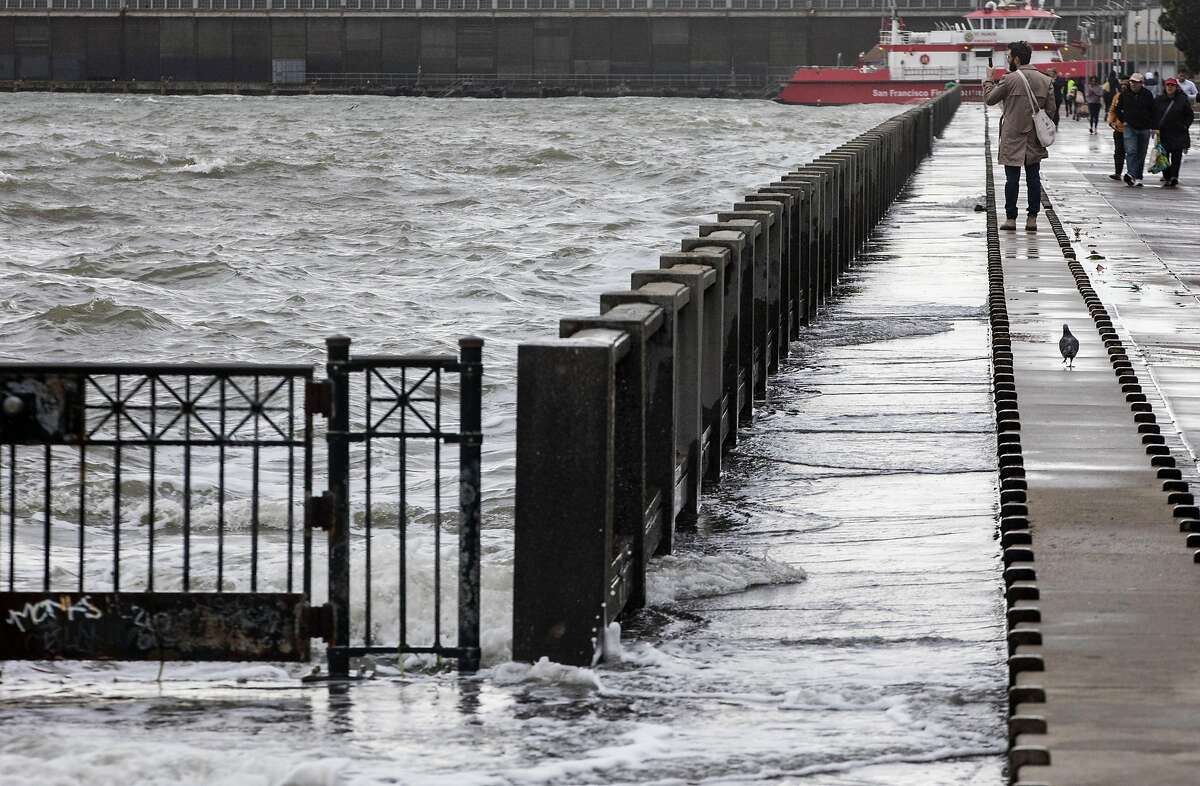
Context: Sea-level rise and flooding in the San Francisco Bay Area
Background

  • Academics and climate communicators are looking for ways to promote public support for climate adaptation and the green transition
  • Widespread idea: (psychological) distance is preventing people from engaging:
  • Climate change and sea-level rise are too abstract risks
  • Many believe it will mostly harm future and far-away populations:
    • not personally relevant
  • Hypothesis: Communicating about personalized risks from local coastal flooding will improve concern and support
  • Empirical question if it works! And empirical evidence is mixed (e.g., due to methodological differences)

Research question


  • It is “not clear whether personalized risk messaging will have the effects on public risk attitudes that many advocates and practitioners hope”, i.e., positive effects on “sea-level rise risk perceptions in vulnerable coastal areas”, so…


  • RQ: Does providing people with information about projected coastal flooding in their area increase concern about sea-level rise and willingness to pay for climate adaptation measures?

Research design:
simple survey experiment fielded in the San Francisco Bay area

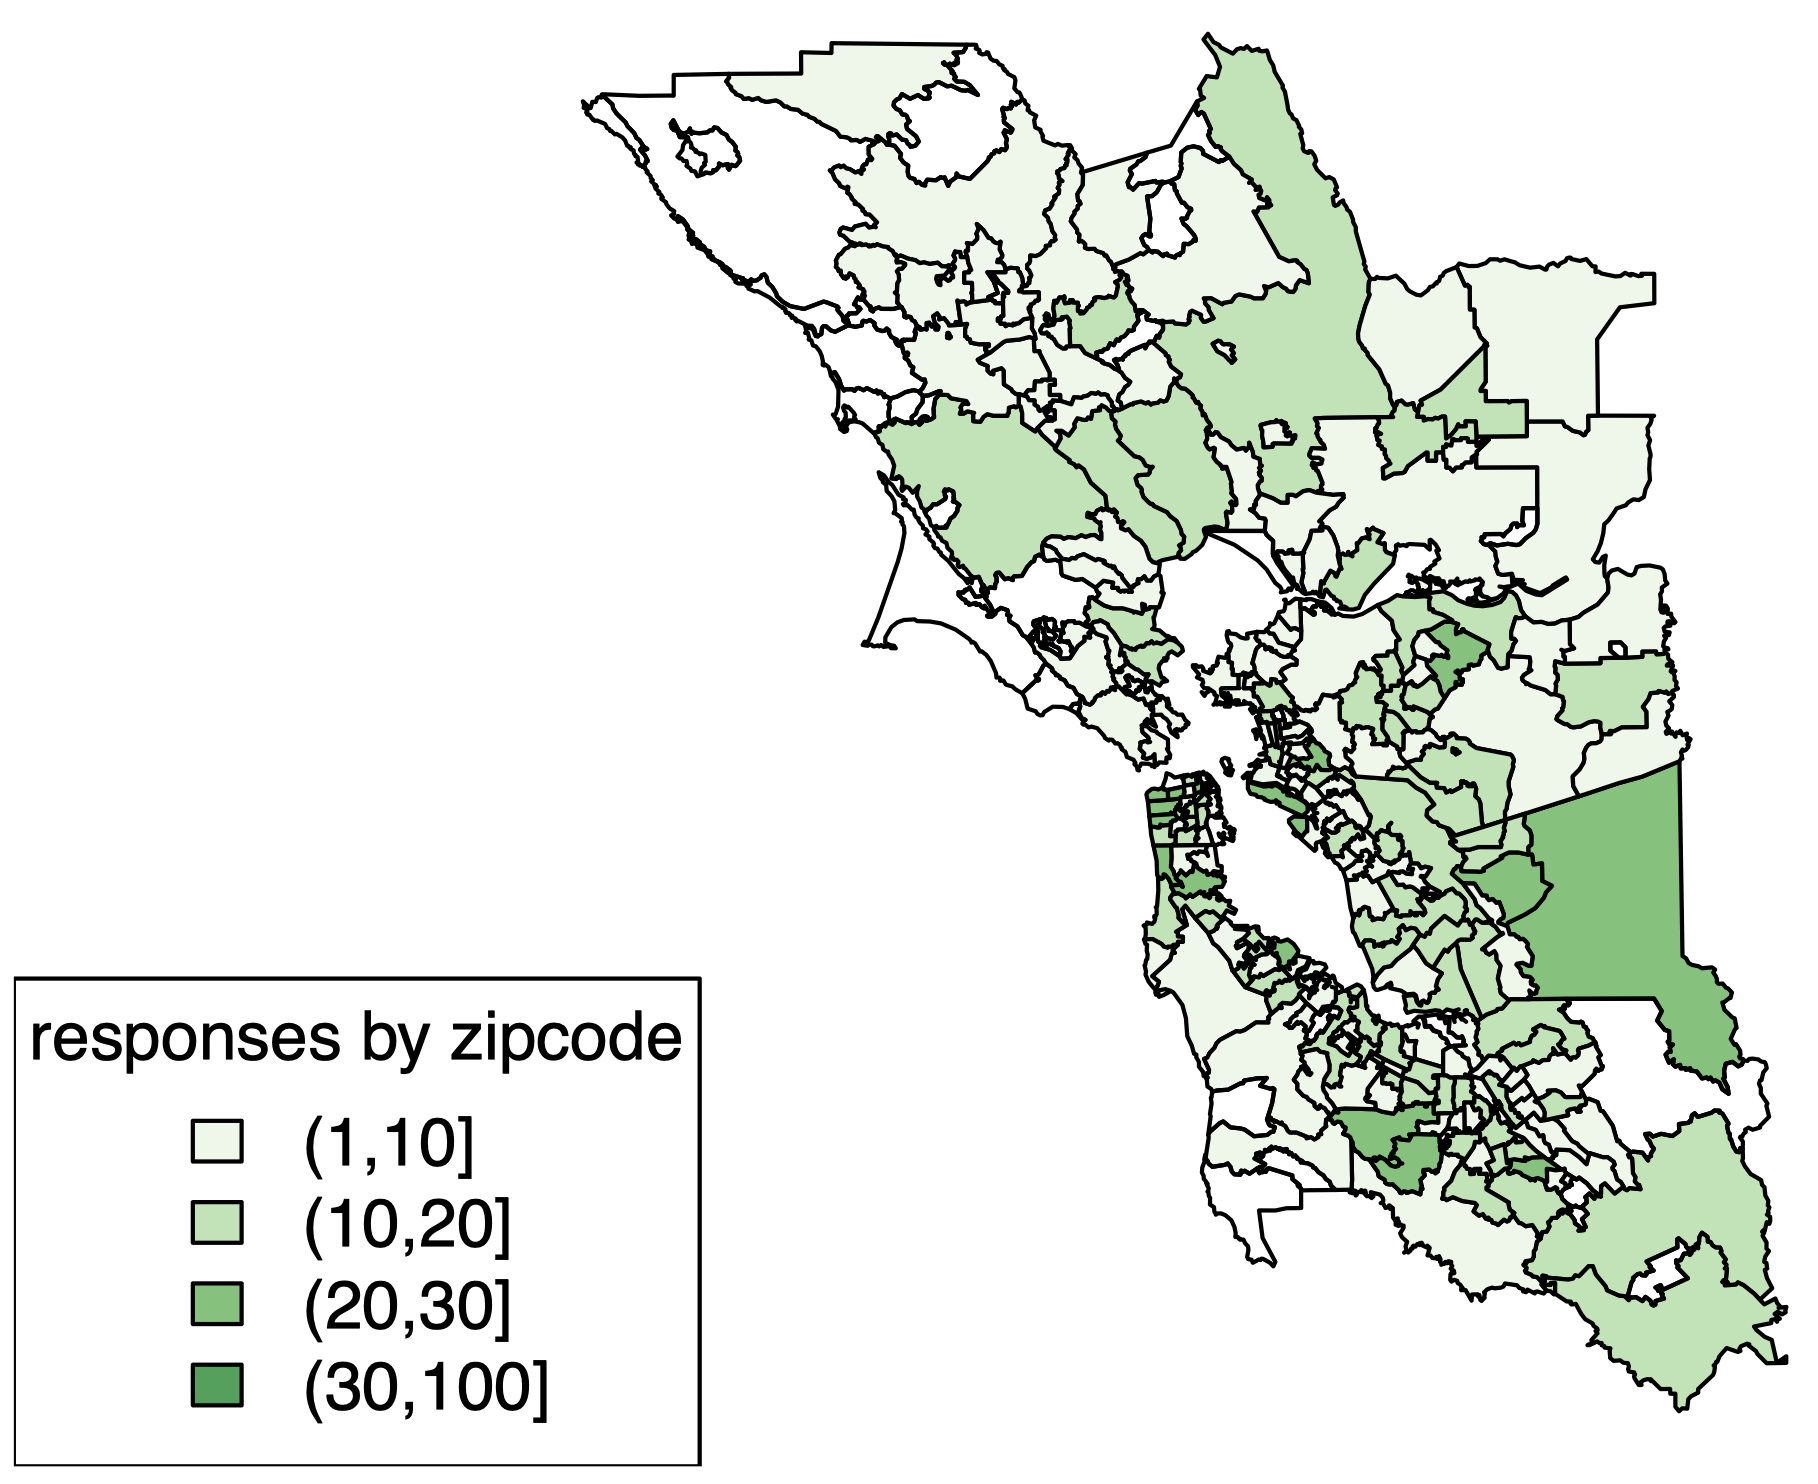
Sample


  • Qualtrics
  • Households in San Francisco Bay area: 9 counties (329 zip code areas, 258 areas with 1-17 respondents)
  • N = 2201
  • somewhat skewed sample
  • some potential issues with zip codes

Survey with three sections


  1. Background questions
  2. Map treatment
    • Treatment group 1:
      map of projected flooding in zip code area with 1m sea-level rise
    • Treatment group 2:
      map of projected flooding in zip code area with 1m sea-level rise plus 100-year storm
    • Control group: nothing
  3. Outcomes: (1) concern about sea-level rise and (2) WTP for regional adaptation policy

Background questions


Zip code. In this survey, we would you like to ask you some questions about your local experiences. To let us ask you questions that are relevant to your community, please let us know your 5-digit zip code in the box below.


Ideology. One way that people talk about politics in the United States is in terms of left, right, and center, or liberal, conservative, and moderate. Where would you place yourself on that spectrum?


Global warming belief. Recently, you may have noticed that global warming has been getting some attention in the news. Global warming refers to the idea that the world’s average temperature has been increasing over the past 150 years, may be increasing more in the future, and that the world’s climate may change as a result. What do you think: Do you think that global warming is happening?

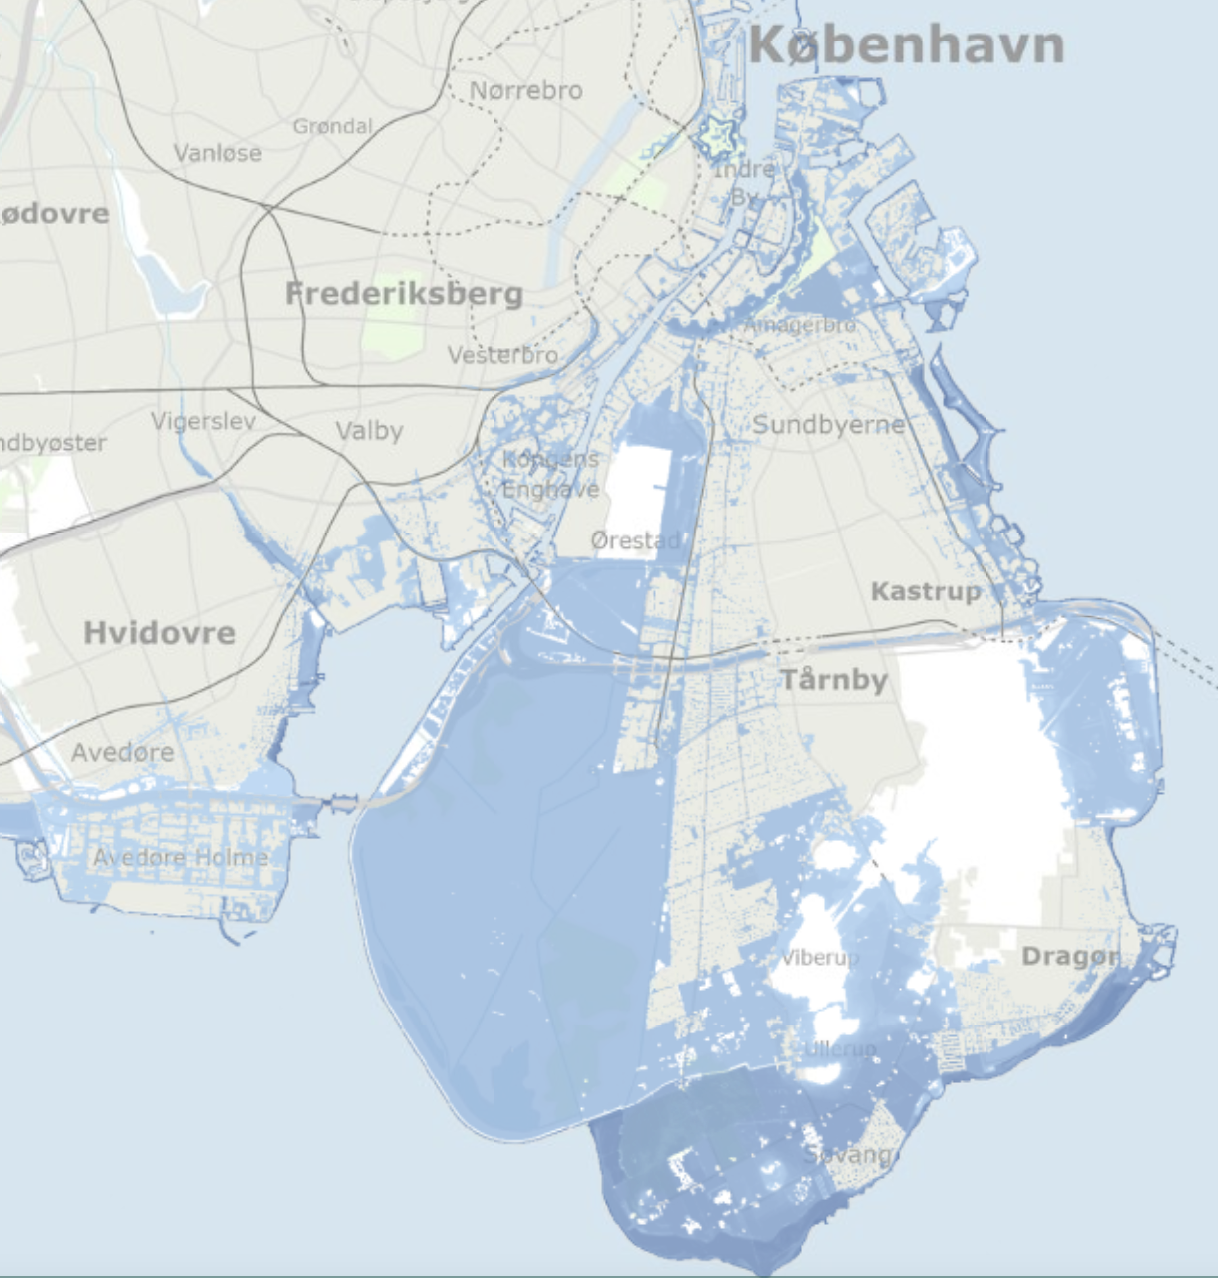
Map treatment: flooding projection tools
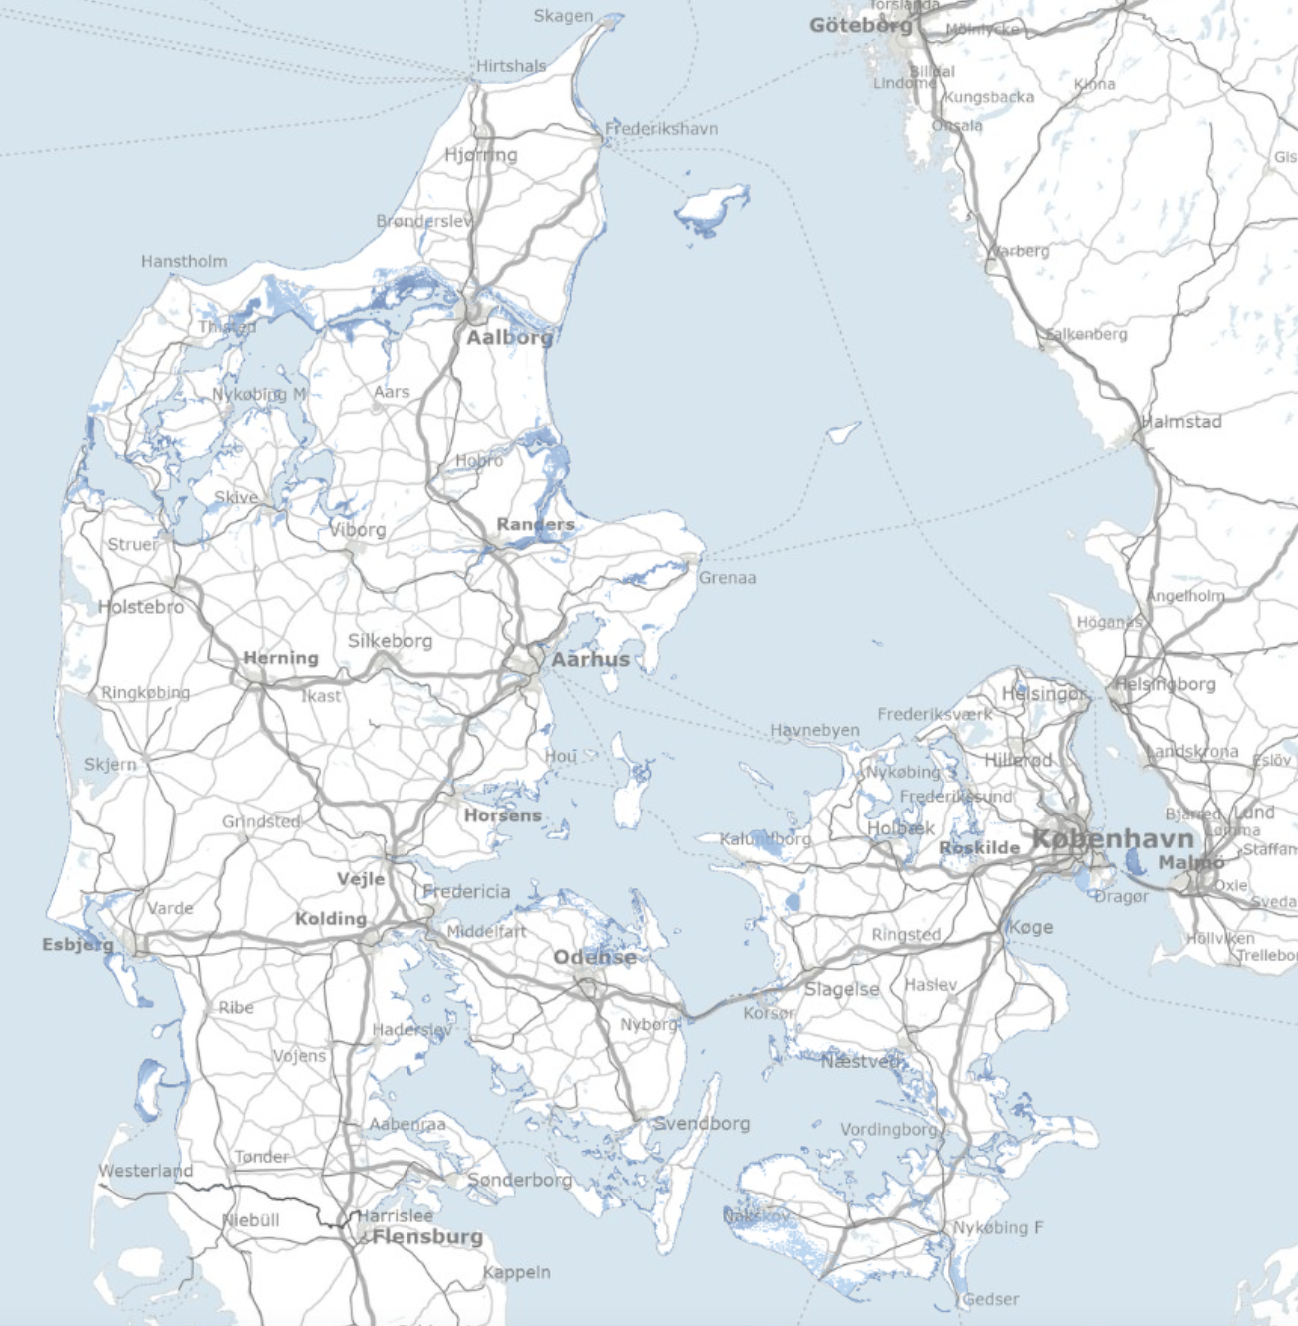
‘KAMP’ projection in Denmark with 3m sea-level rise.

Source: kamp.klimatilpasning.dk.

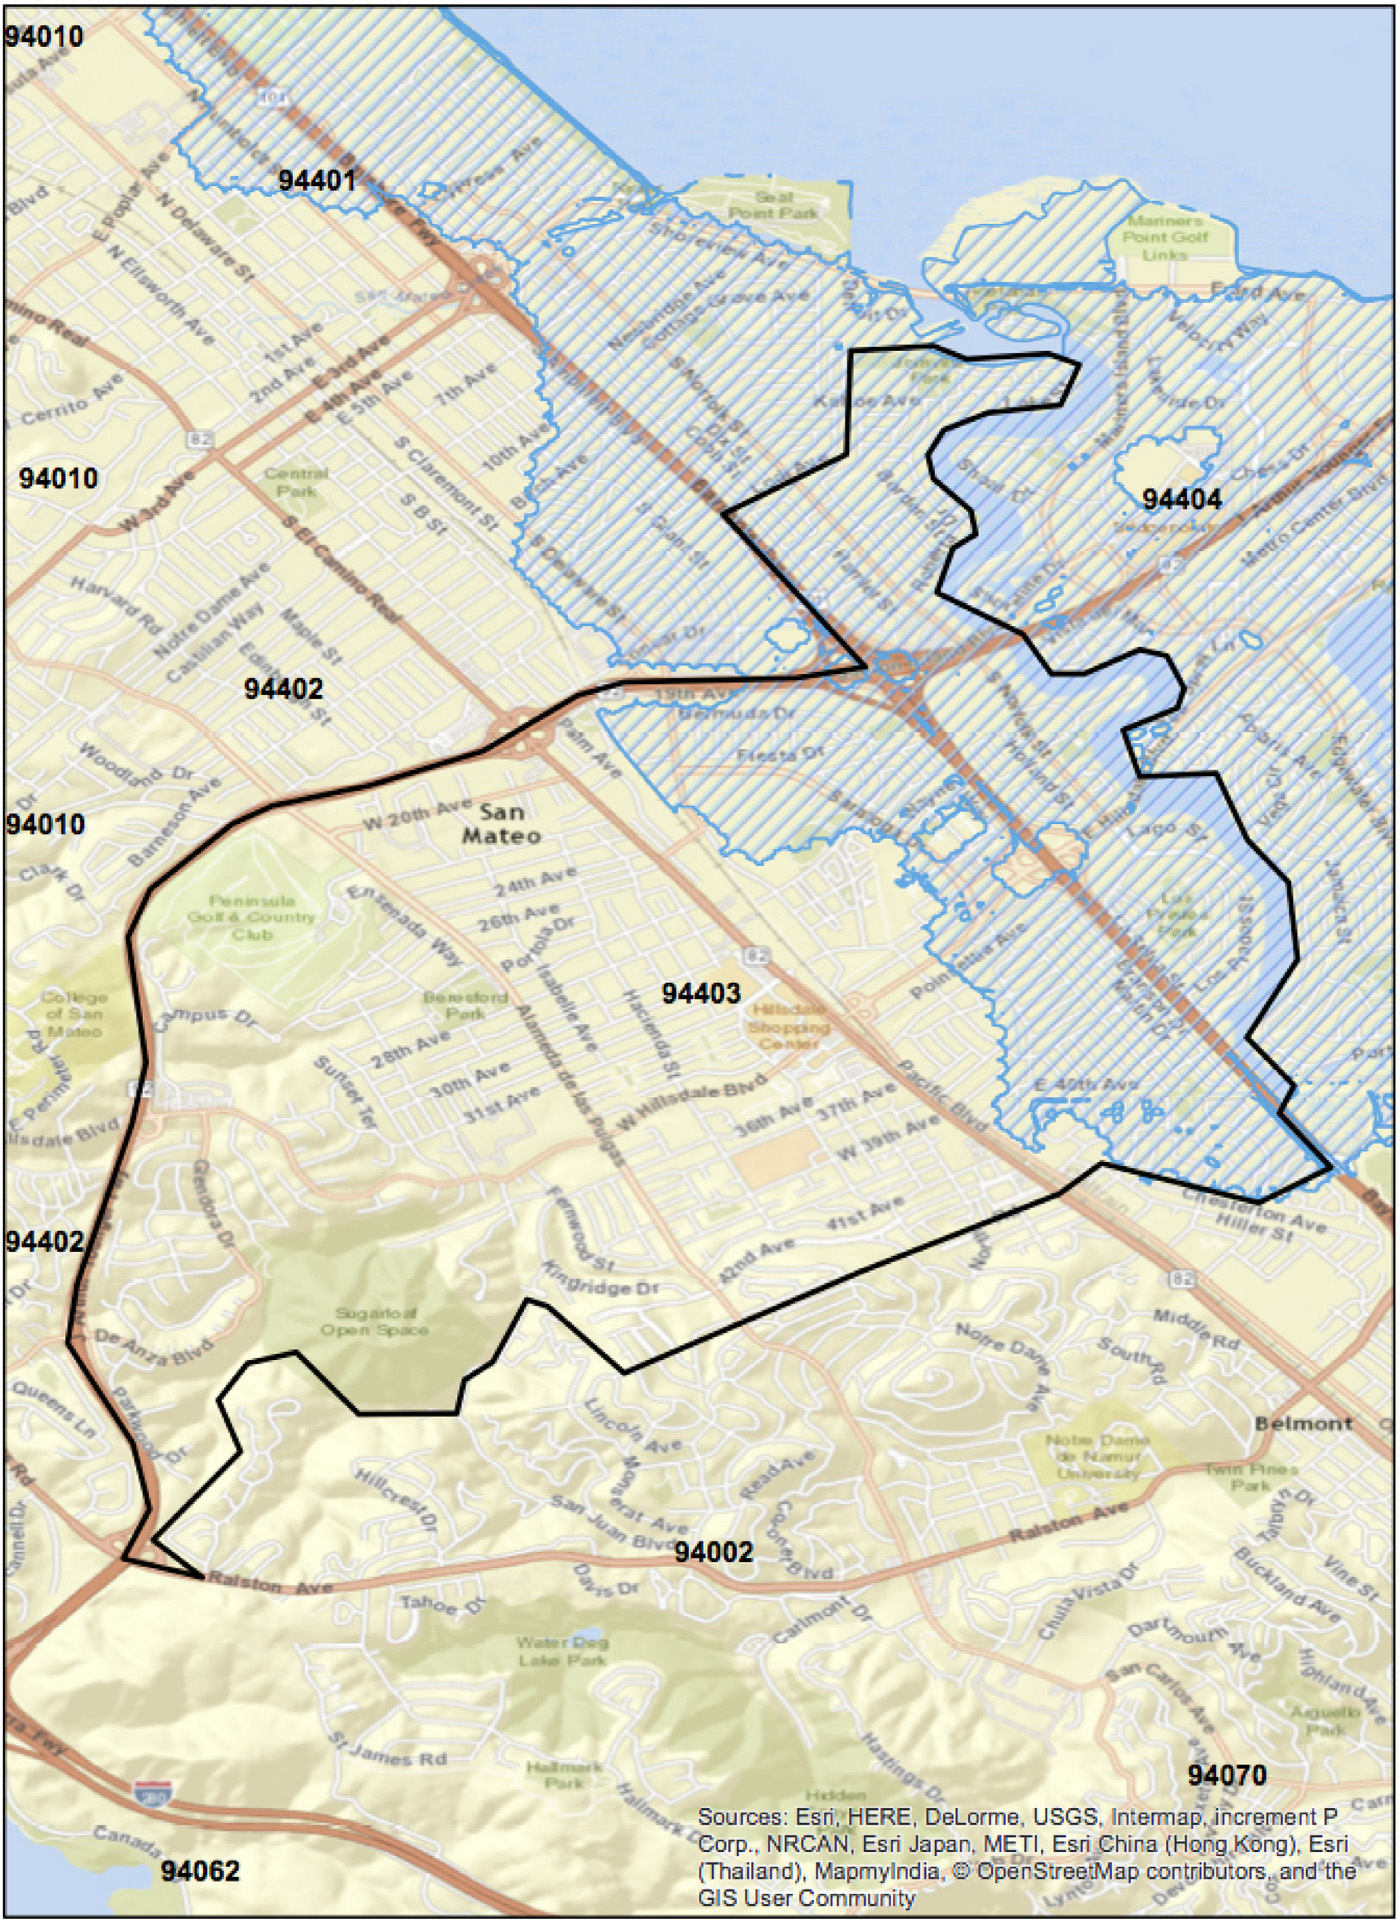
Example treatment

This map shows the flooding risk in your zip code from a 1 m (3.28 feet) sea-level rise. (The map may take a few moments to load). The hatched blue lines indicate the parts of your zip code that will be flooded. If you don’t see any hatched blue lines, there will be no flooding associated with sea-level rise in your zip code. The black lines just give the boundaries of the zip code so that you can more easily find the general location of your home on this map. Please spend a few moments looking at this map. A red button will appear in a few seconds that will let you move on to the next page.

  • 20 second pause!
  • But complex and hard to understand?

Two outcomes


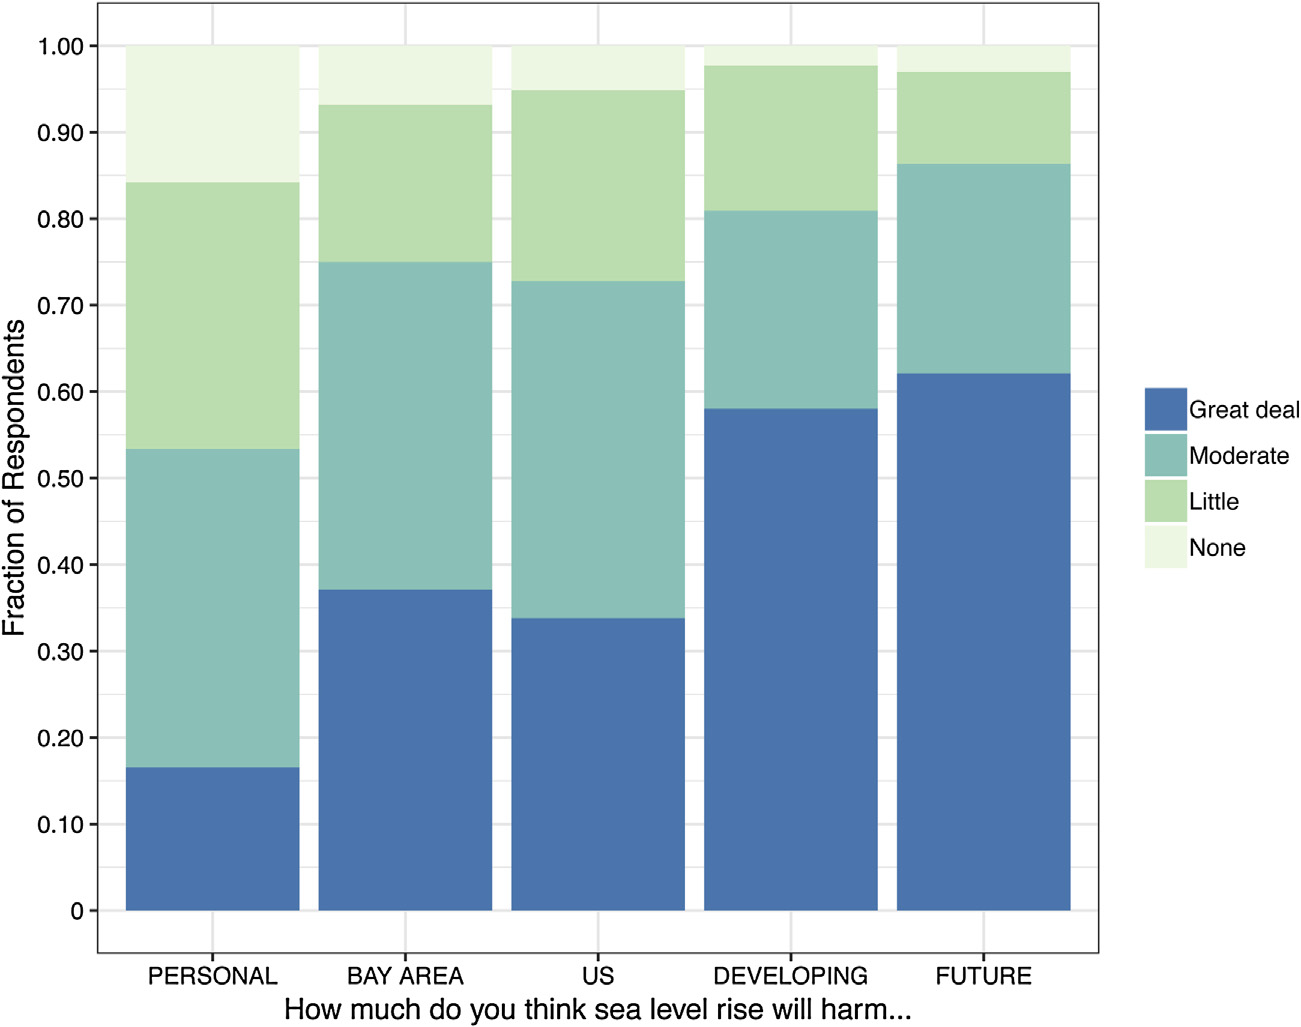
1) How much do you think sea-level rise will harm…?

  1. You personally
  2. People in the Bay Area
  3. People in the United States
  4. People in developing countries
  5. Future generations

Not at all (1), Only a little (2) , A moderate amount (3), A great deal (4), Don’t know


2) WTP for regional adaption measure (details in a minute)

Results

Results 1/6: Baseline concern is lowest for personal harm
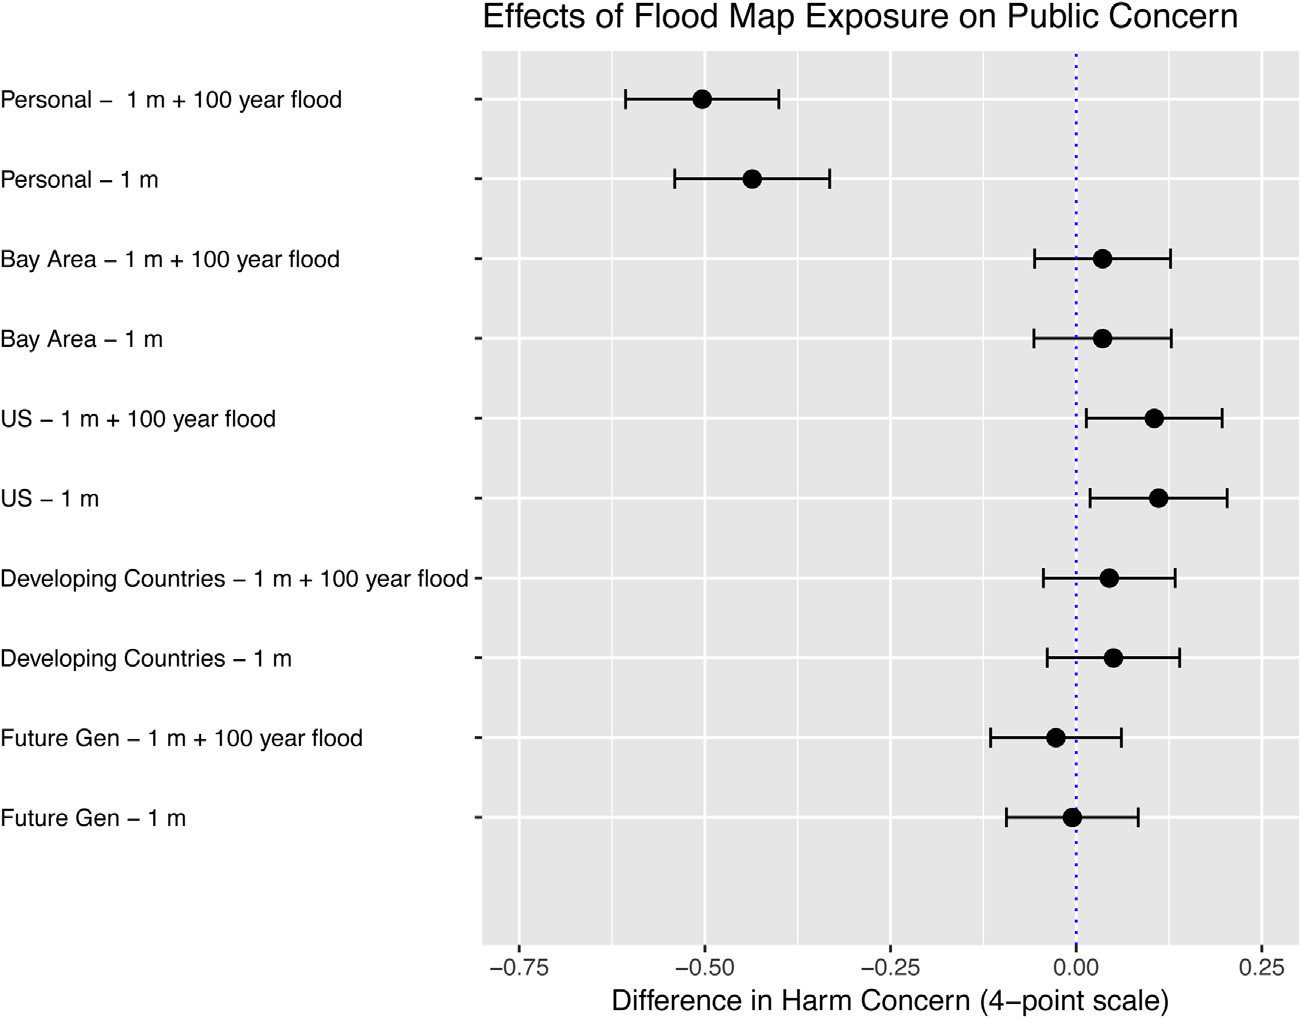
Results 2/6: Main effect is a (surprising?) substantial reduction in concern over personal harm
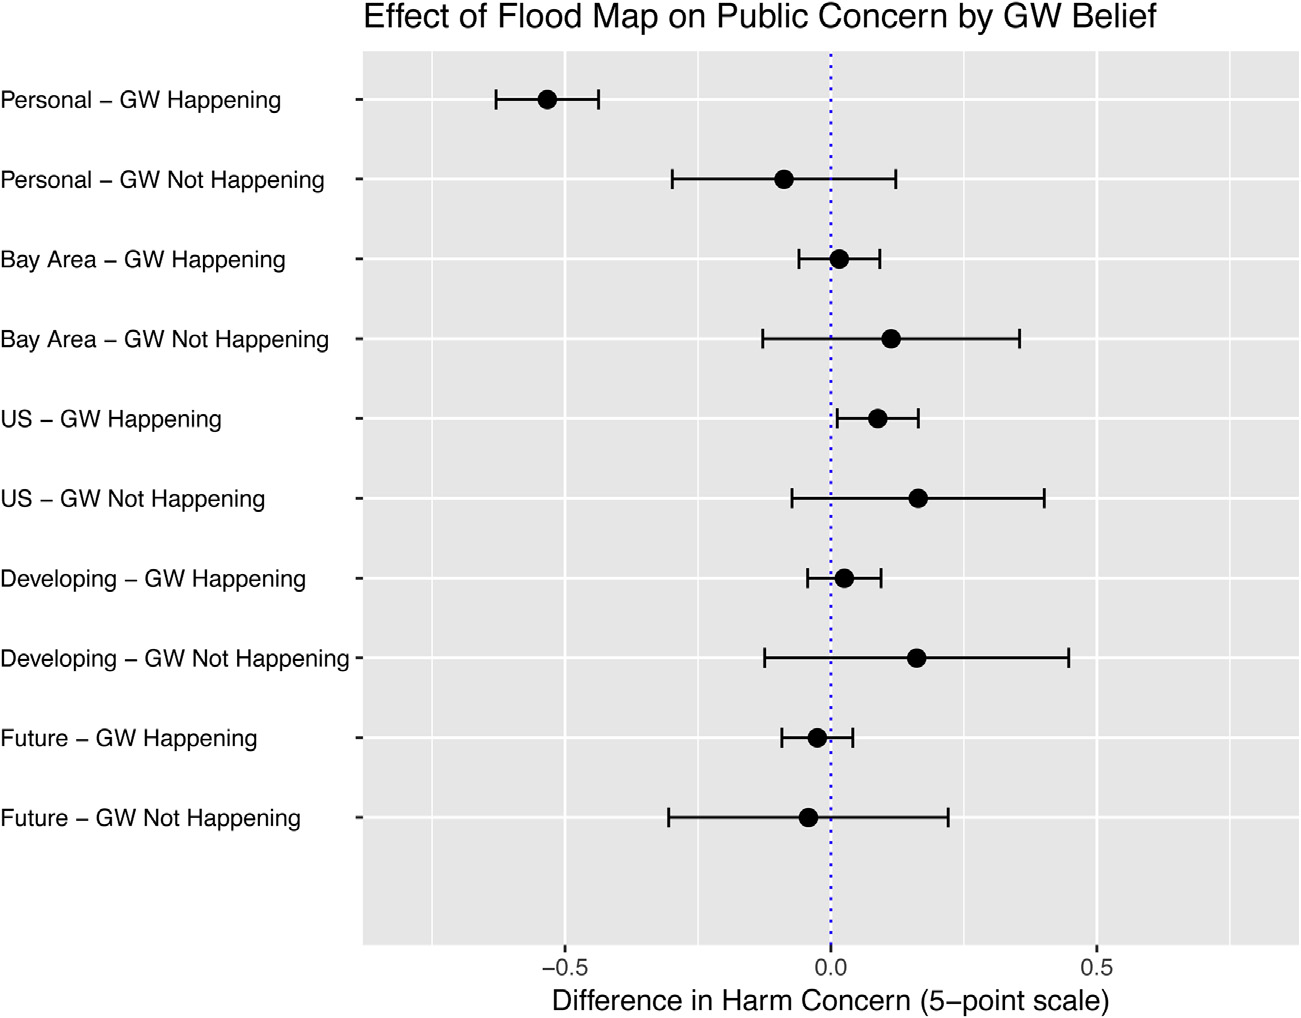
Results 3/6: Effect is driven by people who believe global warming is happening
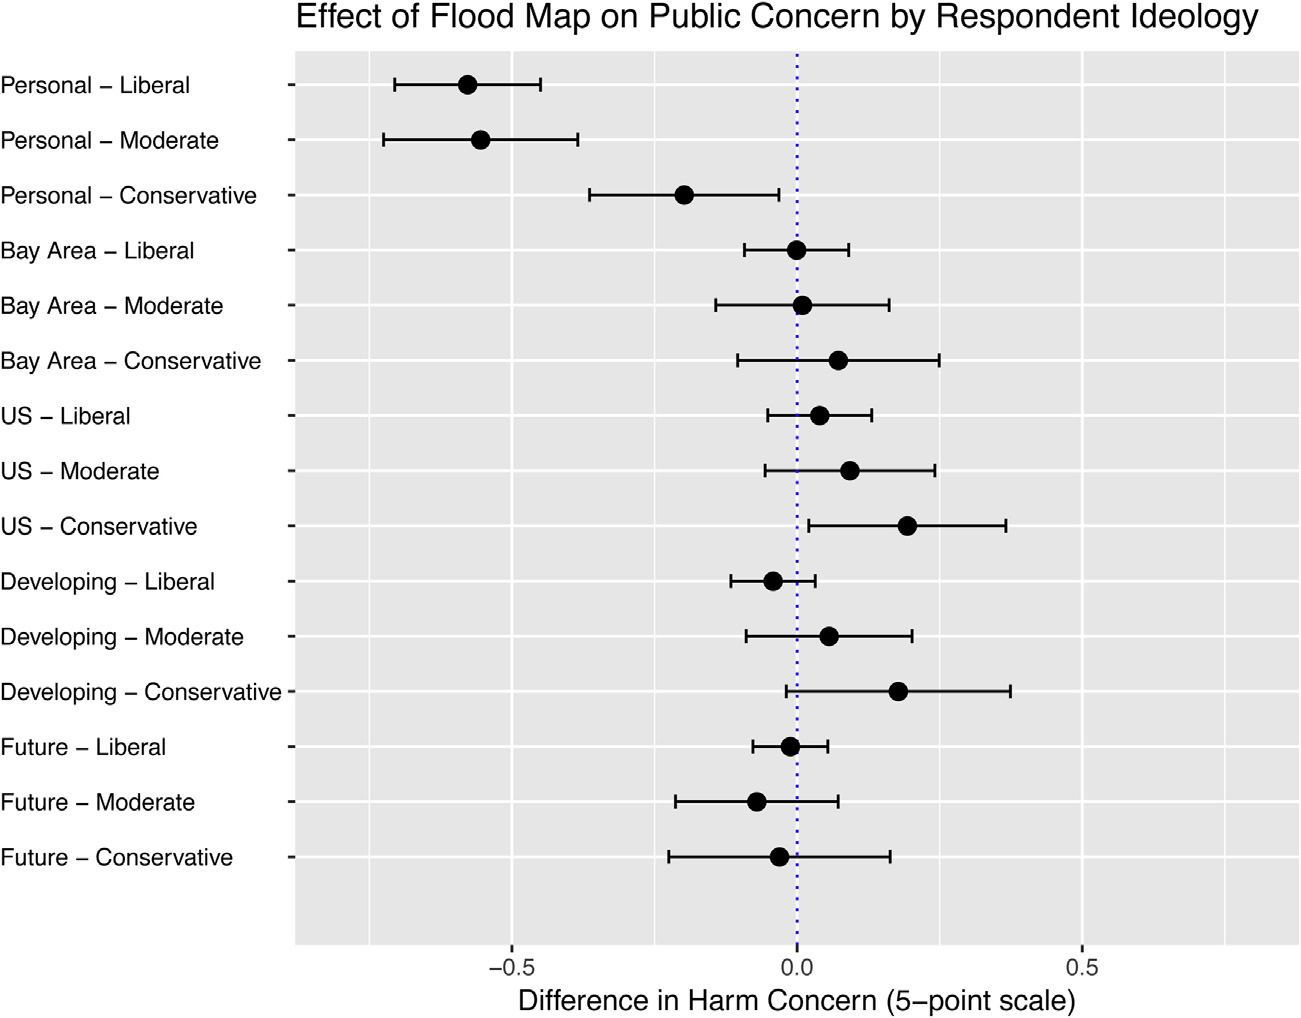
Results 4/6: Effect is driven by ideologically left- and center-leaning people
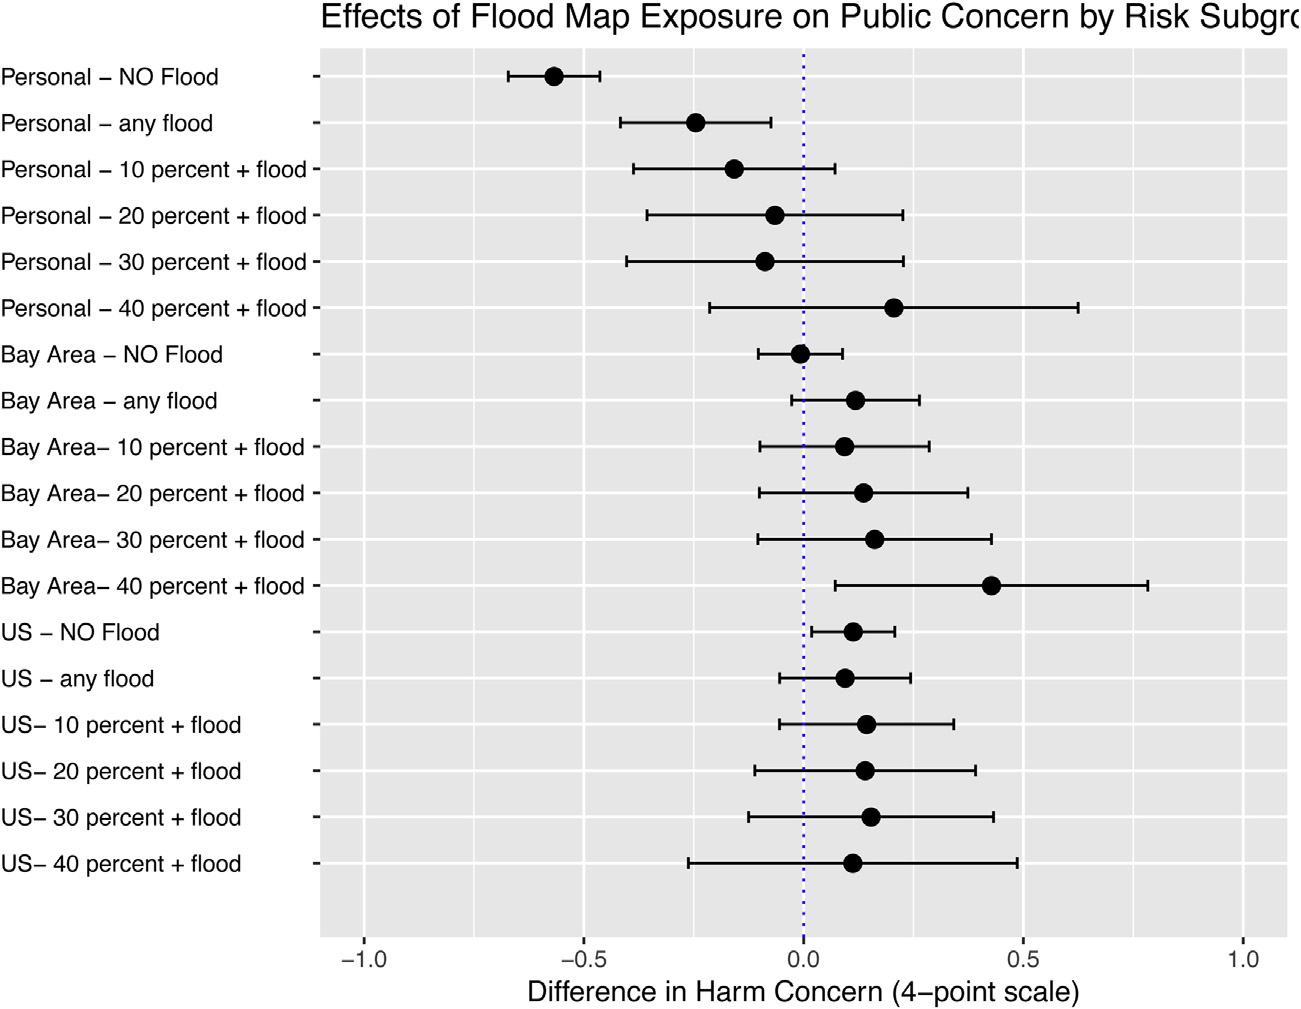
Results 5/6: Effect tracks objective risk nicely:
higher flooding risk → more positive effect
2nd outcome — willingness to pay

Contingent valuation of policy proposal (single-bounded dichotomous choice)

2nd outcome — willingness to pay

Contingent valuation of policy proposal (single-bounded dichotomous choice)


Information about recent passage of ballot Measure AA to fund the San Francisco Bay Clean Water, Pollution Prevention and Habitat Restoration Program, which restored wetlands across the Bay Area through a $12 annual land parcel tax, offering substantial climate adaptation benefits.


If another ballot initiative was offered for a parcel tax of [MONEY AMOUNT] per year to [USE CASE], would you support this ballot measure or not?

  • MONEY AMOUNT:
    $1, $2, $5, $10, $20, $50, $100
  • USE CASE:
    (a) “build flood control infrastructure”
    (b) “prevent the impacts of sea-level rise”
    (c) “support wetlands restoration”
  • Estimate WTP in treatment vs. control group

Result 6/6: No reduction in WTP


  • Negative effect of cost in both groups:
    • 1% reduction in support per $4.76 (treatment group) and $4.00 (control group)
  • But no difference between treatment group and control group
    • → no reduction in WTP
  • “Encouragingly, negative responses to flooding risk maps did not translate into a reduced willingness-to-pay for proposed climate adaptation infrastructure”

Why reduced concern?


  1. Fear → avoidance; “false” warnings; backlash from exaggerated fear appeals

  2. Construal-level theory: qualitatively different engagement with risk depending on distance/abstractness; salience and distance are different

  3. Ideologically grounded motivated reasoning


  1. “[I]n the absence of specific information about local flooding, individuals may rely on their strong climate change beliefs to inform sea-level rise risk perceptions. But when confronted with more specific information, those same individuals may begin to process the sea-level rise threat in the context of different emotional and cognitive considerations, and fixate more on specific local risk factors.”

Four issues

  1. The sample and external validity:
    • Only SF Bay (and only US), poor representativeness, low response rates (8-12%), slightly obscure zip code-based sampling procedure
  2. The treatment:
    • Information vs. priming? Possible problem that it is not placebo-controlled? The fact that the two map types yield same results point to priming effect?
    • Very hard to understand and digest risk information in maps
    • What do people actually learn? A majority learn that they are safe, only a minority that that will be harmed → a reduction, on average?
    • Zip-code areas abstract, not valuable or meaningful on their own, non-individual

Four issues

  1. Outcome questions:
    • Concern: “How much do you think sea-level rise will harm…” with 4-point response scale: Highly verbal, imprecise, essentially subjective expectation (beliefs) … but not used that way (referred to as ‘public concern’)
    • May update expectations (reduced personal concern) but not care/worry (more) about that particular risk object (personal harm)
    • WTP: Very imperfect measurement approach, complex vignette, no inattention or comprehension checks
    • Also no incentives: Free to say “yes” to whatever
      (average WTP: $59 per year = high?)
  2. Hugely contextual

Thanks!